Entries from August 1, 2020 - August 31, 2020
OECD leading indicators recovering, note statistical meddling
Followers of the OECD’s leading indicators take note: the organisation has recently altered the smoothing method used in constructing the indices, increasing the risk of false signals or “whipsaws”.
The OECD’s indicators are used here to confirm signals from monetary trends. The indicators lead the economy at momentum turning points by 4-5 months on average versus 9 months for real money. (The indicators are released later than monetary data and are subject to larger revisions so these numbers understate the real time advantage of relying on monetary analysis for forecasting.)
The calculation method for the indicators historically incorporated smoothing of component data to remove short-term noise. This incurred a cost in terms of slightly reducing the lead time at turning points but had the greater benefit of increasing confidence in the validity of signals, i.e. identified turning points were usually followed by sustained directional moves.
This is illustrated by the first chart, showing “unofficial” versions (i.e. calculated here) of the US indicator with and without smoothing. The unsmoothed indicator, although slightly more timely at “true” turning points, gives many more false signals.

What happened this year? The OECD suspended release of its indicators in March because of uncertainty about the data impact of lockdown restrictions. A decision then appears to have been taken, unannounced, to resume publication on the basis of unsmoothed data.
This can be seen by comparing the second chart, showing the “official” US leading indicator series, with the smoothed and unsmoothed indicators in the first chart. The smoothed historical data appears to have been chained to unsmoothed data in 2020.

What motivated this change? US / global GDP bottomed in April. The smoothed US indicator bottomed in June. OECD statisticians would have been aware that the smoothed indicators were likely to lag on this occasion so may have decided to emphasise the unsmoothed indicators, which in most countries reached lows coincident with activity in April.
A switch back to smoothed data seems likely at some point but will take some explaining given the recent lack of transparency.
From a practical perspective, the key takeaways are:
1. The June turning point in the smoothed US indicator supports the “monetarist” view that the economy has entered a sustained expansion phase.
2. Any declines in the “official” indicators, assuming that they continue to be based on unsmoothed data, should be ignored unless sustained for several months.
Industrial output rebound bullish for equity earnings
There is no contradiction between unprecedented GDP falls and optimism about equity market earnings.
Global GDP and industrial output have been tightly correlated historically but with industrial output displaying three times the volatility of GDP – compare the left- and right-hand scales in the first chart.

This relationship has broken down in 2020 because covid health restrictions have undermined the usual relative resilience of services activity, which dominates GDP. The "beta" of industrial output to GDP has been much smaller than in previous recessions.
This is important for investors because equity market earnings have a large industrial element and hence a stronger correlation with industrial output than GDP.
The second chart shows the relationship of S&P 500 12-month forward earnings and global industrial output. Forward earnings overshot the historical relationship in 2018 because of corporate tax cuts. They fell by less than suggested by output during the covid shock but 12-month rates of change bottomed around the same time (April for output, May for earnings) and are currently consistent.

A further reason for the relative resilience of industrial output is that services activity restrictions have caused consumers to divert spending towards goods. Global retail sales appear to have risen further above their pre-covid peak in July, based on partial data – third chart.

The unexpected strength of goods demand coupled with production restrictions have resulted in an involuntary drawdown of inventories, which firms will attempt to reverse during H2 – an additional reason for expecting a V-shaped industrial recovery to continue to unfold.
Such a scenario implies a bullish earnings outlook – claims that forward earnings are already overoptimistic appear wide of the mark.
Positive earnings developments, however, could be neutralised or outweighed by a rise in real discount rates as the “excess” money backdrop becomes less favourable. The gap between six-month rates of change of global real narrow money and industrial output remained wide in July but could close by October – see previous post.
Global monetary update: money growth still strong, lending slowdown to extend
Monetary data for July are available for countries covering two-thirds of the global (i.e. G7 plus E7) aggregates calculated here. Six-month growth of real (i.e. CPI-adjusted) narrow money is estimated to have risen to another record last month, while real broad money growth stabilised and growth of real bank lending to the private sector slipped for a second month – see first chart.

Six-month real money growth is almost certainly peaking, implying a possible peak in six-month industrial output momentum around April 2021, allowing for an average nine-month lead.
The monetarist view is that the surge in money measures since early 2020 will be reflected in a significant rise in inflation in 2021-22. This does not, as is sometimes asserted, assume that the velocity of circulation reverts to its pre-crisis level, only that the trend rate of decline in recent decades does not accelerate.
Previous posts argued that the main driver of this trend velocity decline has been a rising wealth to income ratio – rising wealth boosts the portfolio demand for money. The trend fall in real yields has probably also been a factor. Investors believing that the trends in the wealth to income ratio and / or real yields are overextended and likely to reverse should anticipate a slower trend decline in velocity, i.e. more inflation per unit of money growth.
The monetarist jury is out on the issue of whether the expected 2021-22 inflation rise will be temporary or mark a shift to a permanently higher level. A return of broad money growth to its post-GFC average would support the former scenario. The bias here is to expect money growth to remain higher than in recent decades, because fiscal deficits are likely to remain large and require ongoing “monetary financing” to prevent market dislocation.
The legendary market analyst Russell Napier argues that broad money growth and inflation will remain high because of government intervention in the commercial banking system to compel sustained rapid expansion of credit to favoured companies and projects. The recent use of subsidies and guarantees to boost lending, according to Mr Napier, is transformational and implies that politicians have wrested control of the money supply from central banks. They will use this power in a dash for growth and in order to create inflation to reduce real debt burdens.
This scenario could play out over the medium term but the recent monetary boost from bank lending is likely to fade in H2 2020.
Broad money growth is significantly higher than lending growth currently, i.e. monetary deficit financing has been the more important driver of broad money acceleration.
Lending growth, as noted, appears to have peaked. The recent slowdown mainly reflects US developments: the stock of US commercial bank loans and leases contracted in June and July.
The earlier pick-up in global / US lending growth was partly accounted for by loans advanced under the US Paycheck Protection Program (PPP), most of which are likely to be cancelled / forgiven in H2 2020 / early 2021. This will depress the lending numbers although broad money will be unaffected because of a simultaneous transfer of cash from the Treasury to banks (i.e. more monetary deficit financing).
Aside from the PPP effect, US bank credit demand appears weak. An average of demand balances across loan categories in the July Fed senior loan officer survey fell to its lowest level since 2009, suggesting a further lending slowdown – second chart.

Will industrial commodity prices surge?
The global 3-5 year stockbuilding (inventory) cycle probably bottomed in Q2. The negative contribution of inventories to the annual change in G7 GDP is estimated to have been comparable with or larger than at the trough of the 2008-09 recession. Destocking appears to have been mostly involuntary, reflecting covid restrictions having a larger negative impact on goods production than demand.
A Q2 trough would imply a cycle length of 4.25 years – the prior low occurred in Q1 2016. The previous two cycles – 2009-12 and 2012-16 – lasted 3.5 and 3.25 years respectively. The average length of the cycle historically (i.e. since the 1960s) was 3.5 years*.
Industrial commodity prices usually weaken during cycle downswings but rebound in the restocking phase. The first chart shows the annual change in an index of industrial commodity prices and the contribution of stockbuilding to the annual G7 GDP change – a positive correlation is apparent. Commodity prices fell by 9.6% on average in the 12 months leading up to a cycle trough, rising by 14.3% in the subsequent 12 months.

Strong global monetary expansion suggests an increased probability of a commodity price surge. Global annual narrow money growth is at a post-WW2 record. The second and third highest readings occurred in November 1972 and August 2009 respectively. These monetary surges preceded the two highest peaks in annual industrial commodity price inflation, of 53.5% (December 1973) and 74.5% (March 2010).
Commodity price strength could drive an early and sharp pick-up in producer price inflation. Strikingly, the input and output price indices in the global manufacturing PMI survey have already returned to pro-covid levels, following only modest weakness during the economic contraction phase – second chart.

A commodity price upswing could sustain the recent uptrend in bond market inflation expectations, in turn raising questions about the credibility of central bank guidance that super-easy monetary policies will be maintained far into the future.
*Cycle dates are assessed judgementally taking into account average cycle length, the contribution of inventories to the annual G7 GDP change and business survey inventory responses.
Lagging Chinese money growth isn't concerning
Money measures have surged in most major economies. Narrow money outperforms broad money as a leading indicator of economic activity. Annual growth of the official M1 measure in June was 35.9% in the US, 22.0% in Canada, 15.2% in the UK, 12.6% in the Eurozone and 12.3% in Japan.
Brazil, amazingly, topped the US surge with 38.3% annual growth.
China, however, has lagged – official M1 growth was 6.5% in June and 6.9% in July. This contrasts with the run-up to the 2016-17 global economic mini-boom, when Chinese M1 growth moved ahead of most other countries, reaching a peak of 25.4% versus around 10% for the G7 majors.
For some, Chinese money trends are a key missing link in the global economic rebound story, warranting investors staying underweight cyclical assets and overweight “defensives”.
This is a somewhat strange argument – why should Chinese money data give a better signal for global economic prospects than a global M1 aggregate growing at a record pace despite Chinese sluggishness?
In any case, the suggestion that Chinese narrow money trends are giving a negative signal for Chinese, let alone global, economic prospects, is judged here to be incorrect, for the following reasons.
1. Direction trumps magnitude when assessing the M1 signal. Chinese annual M1 growth has risen from zero in January 2020 to its current 6.9%.
2. The Chinese M1 measure, inexplicably, departs from global convention by omitting household demand deposits, data for which are, however, released monthly. “True” M1, incorporating these deposits, grew by an annual 8.3% in June with the official M1 number suggesting a rise to 8.6% in July*.
3. Relatively sluggish annual growth reflects weakness in H2 2019 and conceals solid sequential expansion since early 2020. Six-month growth of true M1, seasonally adjusted, was an estimated 7.0% in July, or 14.5% annualised.
4. The recent acceleration has been stronger in real terms because of a sharp fall in six-month consumer price momentum driven by declining energy costs and a slowdown in pork prices.
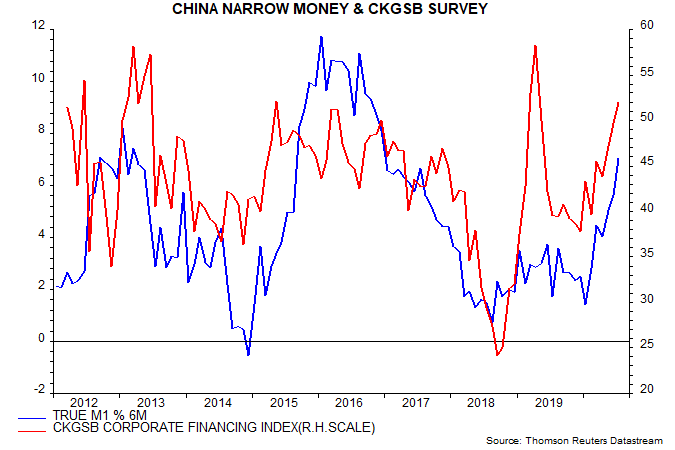
5. Narrow money acceleration has been accompanied by an easing of credit conditions, reflected in the corporate financing component of the Cheung Kong Graduate School of Business (CKGSB) survey of private firms – see chart. Credit conditions tightened sharply after April 2019 as regional banks faced funding difficulties and restricted loan supply, with a knock-on negative impact on economic activity and narrow money demand. The strong rebound in the CKGSB index supports economic optimism and suggests a further rise in six-month true M1 growth.

*The household demand deposits number for July yet to be released – the estimate assumes that annual growth of such deposits remained at 12.0%.
Equities / cash switching rule update
The "monetarist" equities / cash switching rule followed here recommends unhedged global equities (MSCI World index) only when the following two conditions are satisfied:
1. Six-month change in global (i.e. G7 plus E7*) real narrow money above six-month change in industrial output;
2. 12-month change in global real narrow money above slow moving average (currently at 5.6%).
The thinking is that fulfilment of the two conditions is likely to indicate that money holdings are growing faster than the demand for money to support economic activity, in turn suggesting that demand for financial assets, including equities, will increase, with associated upward pressure on prices.
The rule is applied at the end of each month and allows for data reporting lags – one month for real money and two months for industrial output.
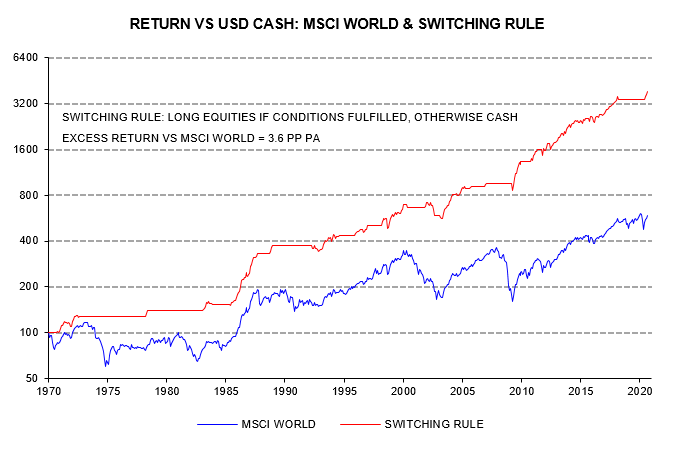
The first chart compares the backtested cumulative return relative to Eurodollar deposits from following the rule with the return on equities (the horizontal sections represent periods when the rule was in cash).

The rule was in cash at the start of 2020 because condition 2 was unmet. Global 12-month real narrow money growth crossed above the slow moving average in March, surging to 8.8% from 4.7% in February. Accounting for the one-month reporting lag, the rule switched into equities at end-April.
No judgement is applied in implementing the rule. Weekly US money data released on 2 April showed that annual narrow money growth had jumped from 6.2% in February to 17.0% in the week ending 23 March. Allowing for a US weight of 28%, this was a strong signal that the global 12-month real narrow money growth measure would cross above the moving average in March. The MSCI World index rose by 13.9% between 2 April and month-end, when the rule switched into equities.
12-month global real narrow money growth stood at 16.6% in June, far above the moving average. Condition 2 is likely to remain satisfied through H2 2020.
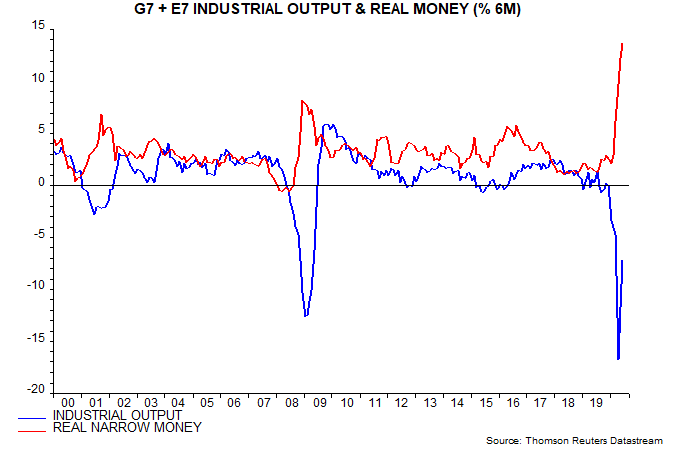
The six-month rate of change differential between global real narrow money and industrial output peaked at record 26.5 percentage points (pp) in April, narrowing to 20.8 pp in June as a V-shaped industrial recovery started to unfold – second chart.

The monthly rise in global real narrow money has fallen from a March peak of 3.9% to 3.6% in April, 2.8% in May and 1.6% in June. Suppose that monthly growth is maintained at 1.6% while global industrial output rises at a constant rate to return to its December 2019 level in December 2020 – regarded here as a plausible scenario. On these assumptions the six-month rate of change differential between global real money and output would turn negative in October, causing the switching rule to recommended a move out of equities into cash at end-December.
Any such cross-over could prove short-lived – industrial output could slow sharply when a V recovery is complete while low rates and continued QE could sustain solid money growth.
As previously discussed, real Treasury yields are usually sensitive to changes in the real money / output growth differential. A rise in real yields over coming weeks would support the view that the monetary backdrop for equities is starting to become less favourable.
*G7 plus seven large emerging economies. G7-only data were used pre 2005.

