Entries from August 1, 2018 - August 31, 2018
Are UK monetary clouds lifting?
UK monetary growth recovered further in July but could fall back in the wake of this month’s rate hike. August data should be awaited before upgrading economic expectations.
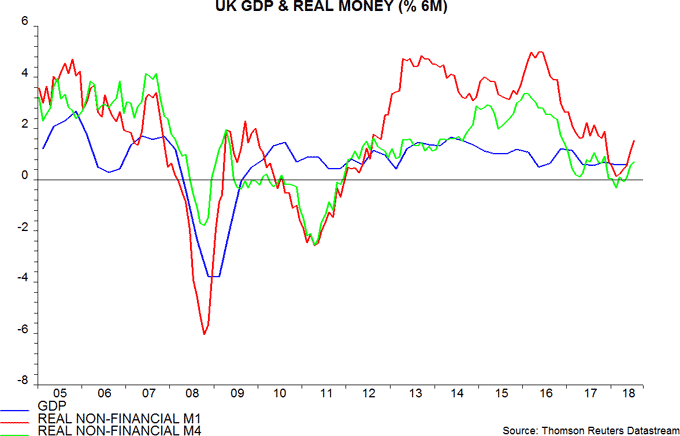
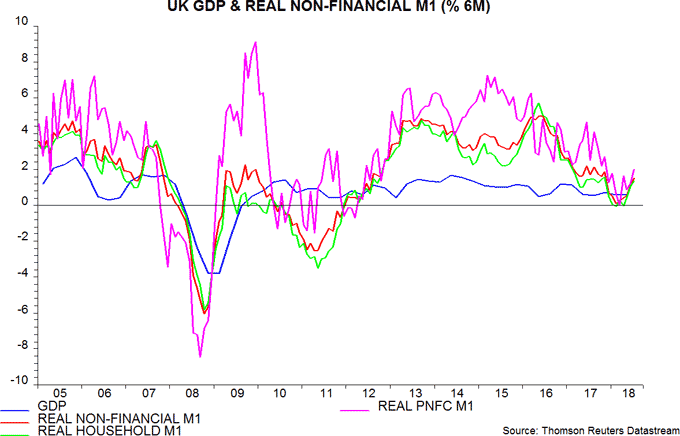
Six-month growth of real (i.e. inflation-adjusted) narrow money, as measured by non-financial M1, rose to its highest level since November 2017 in July, though remains below its range over the prior five years (i.e. back to August 2012). Real broad money – non-financial M4 – has also reaccelerated, following significant weakness earlier in 2018 – first chart.
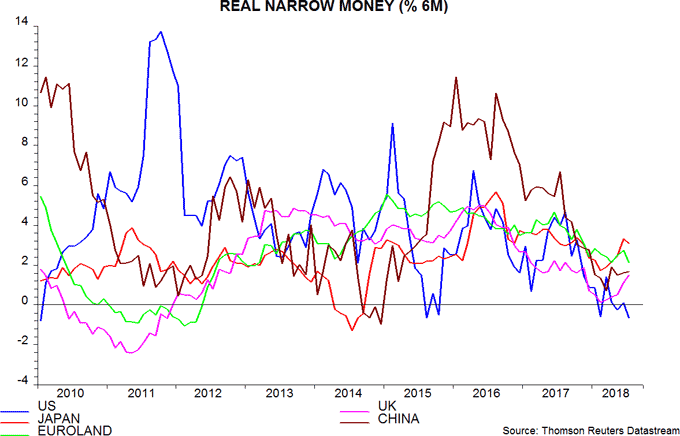
The rise in six-month real narrow money momentum in July contrasts with falls in the US and Euroland. UK growth remains lower than in Euroland but the gap is the smallest since October 2016 – second chart.
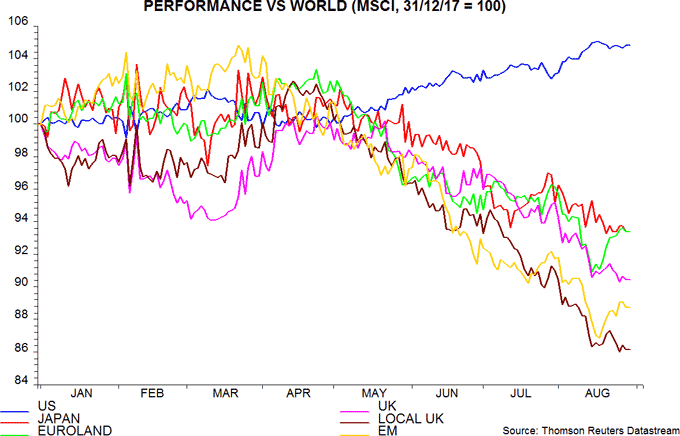
“Local” UK shares – as measured by the FTSE local UK index, which includes companies generating 70% or more of sales from the UK / Europe, the Middle East and Africa – have underperformed other markets significantly in currency-adjusted terms so far in 2018, undershooting even emerging markets – third chart. Improving absolute and relative monetary trends suggest that the case for underweighting UK shares is weakening.
The caveat, of course, is the unfortunate August rate hike, which risks aborting the monetary recovery. Six-month growth of narrow and broad money fell sharply immediately after the November rate increase.
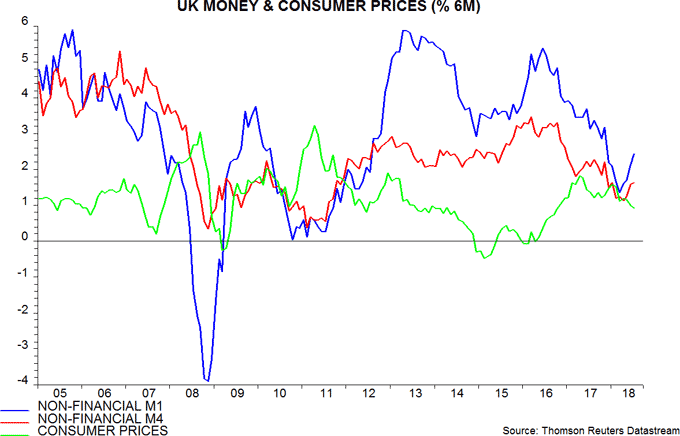
The recovery in real money growth, in addition, has been partly due to a slowdown in six-month consumer price inflation – fourth chart. This could reverse in the wake of recent sterling weakness – the effective exchange rate fell by 2.6% between April and July.
A cautious view of UK economic / market prospects, therefore, will be maintained here, at least pending August monetary data released at end-September.
Sectoral data show that the recent rise in six-month real narrow money growth has reflected increases in both the household sector and private non-financial corporate (PNFC) components – fifth chart. The latter improvement, in particular, is surprising, suggesting that businesses are not yet scaling back expansion plans in response to the supposed increased risk of a “no deal” Brexit.
Euroland money trends suggesting sub-consensus GDP growth
Euro area July money numbers were disappointing, suggesting that GDP growth will stick at its recent slower pace – contrary to consensus hopes that first-half weakening represented a temporary “soft patch”.
As usual, the focus here is on non-financial monetary aggregates, comprising holdings of households and non-financial corporations (NFCs)*. Six-month growth rates of real (i.e. inflation-adjusted) non-financial M1 and non-financial M3 fell in July and are back near lows reached in April and May respectively – see first chart.

Both real money growth measures declined significantly between June 2017 and April / May, correctly signalling the “surprise” weakening of GDP expansion in the first half of 2018. The sideways move since April / May suggests that economic growth will continue at around its recent pace through the first quarter of 2019 – GDP may rise at a 1.25-1.5% annualised rate, below ECB and consensus forecasts of 1.75-2.0%.
The fall in six-month real non-financial M1 growth in July reflected notably weaker expansion of non-financial corporate deposits – second chart. This may signal a scaling-back of business expansion plans in response to uncertainties around US trade policy, Brexit, the ending of QE and Italy / EU relations.
Curbed business expansion would be expected to feed back into consumer spending via reduced hiring and slower expansion of worker incomes. Corporate real M1 holdings display a stronger correlation with future GDP expansion than household holdings, according to ECB research.

The third chart shows six-month growth rates of real non-financial M1 deposits in the "big four” economies. The Euro area slowdown over the past year has been driven by France and Spain, suggesting a greater loss of economic momentum in those two countries – already evident in French GDP data for the first half.

Italian real deposit growth has been volatile but weakened sharply in July. Monetary trends led the Italian / German yield spread around the 2011-13 recession but have lagged the spread recently; with the latter widening further, the monetary slowdown may be sustained – fourth chart.

*The headline M1 / M3 aggregates also include financial sector money holdings, which are more volatile and display a lower correlation with future GDP expansion, according to ECB research.
Business investment: as good as it gets?
Optimists expect strong growth of business investment to relieve capacity strains and allow the global economic upswing to continue for several more years. The view here, by contrast, is that investment strength may be peaking ahead of weakness in 2019-20.
Economists in the first half of the twentieth century were familiar with a 7-11 year cycle in business investment (the Juglar cycle, after nineteenth-century French economist Clément Juglar), along with shorter- and longer-term cycles in inventories and housing construction respectively. The long post-WW2 economic expansion contributed to the idea of distinct cycles in different parts of the economy falling out of fashion in favour of a vaguer concept of an irregular business cycle that could be tamed by wise policy-makers.
A 7-11 year fluctuation in business investment, however, is clearly visible in post-war US / G7 data, with troughs in the cycle plausibly occurring in 1949, 1958, 1968, 1975, 1983, 1993, 2002 and 2009 – see first chart. Another trough, therefore, is scheduled by 2020 at the latest, implying that the cycle will be in a downswing in 2019.

The investment cycle is closely related to the profits cycle, with the latter usually leading by several quarters – second chart. The profits measure in the chart is a national-accounts version of EBITDA and usually moves ahead of cash flow numbers associated with stock market indices such as MSCI World – these numbers are usually presented as four-quarter moving totals. Nominal profits were converted to real terms using the GDP deflator. G7 real profits growth is running below investment growth and eased into the first quarter, despite a rise in the US. Second-quarter figures will be important for assessing whether the investment cycle is already peaking.

The relative weakness of profits trends in Japan and Europe suggests that an investment slowdown should begin there. Japanese and German capital goods orders, indeed, have been surprisingly weak recently, contrasting with a continued rise in US core orders – third chart.

As well as a stronger profits trend, US business investment has been boosted by the boom in oil and gas exploration – mining investment contributed one-quarter of non-residential fixed investment growth of 9.4% annualised between the fourth quarter of 2017 and second quarter of 2018. A recent stalling of the rig count and oil prices, however, suggests that this segment will lose momentum – fourth chart.

A further reason for expecting US business investment strength to cool is the lagged relationship with residential investment, which has slowed significantly since early 2016 – fifth chart. This empirical regularity may reflect housing responding more quickly than business investment to changes in monetary conditions; an alternative explanation is that housing swings affect general economic activity, resulting in an accelerator effect on business investment. For whatever reason, the relationship has been surprisingly reliable historically.

Softening prospects for business investment would be expected to be associated with weaker corporate narrow money trends. No monthly sectoral breakdown of US monetary data is available but the six-month rate of change of real corporate narrow money is lower than a year ago in Japan, Euroland, the UK and China, although there are hints of a bottoming out recently – sixth chart*.

*NFC = non-financial corporation; PNFC = private NFC; NFE = non-financial enterprise.
Equities / cash switching rules: an update
Various posts in recent years discussed two rules for switching between global equities and US dollar cash based on monetary signals. One or other of the rules has recommended cash since end-January, suggesting that a cautious investment strategy remains warranted.
The simple idea underlying the rules is that “high” (to be defined) global money growth is likely to be associated with rising demand for equities and other financial assets, with corresponding upward pressure on prices. Conversely, low or falling money growth may signal selling and downward pressure.
The first rule generates positive or negative signals by comparing six-month rates of change of real narrow money and industrial output*. A positive differential suggests that money holdings are rising faster than needed to support economic expansion, implying a surplus to be invested in markets.
This rule uses G7 plus E7 data from 2000 and G7-only for earlier years. The switch-over date reflects a judgement that E7 monetary trends were of limited significance for global markets before the 2000s.
The second rule recommends equities unless G7 annual real narrow money growth falls below 3% – its average from 1970 until the 2008-09 recession / crisis – or falls by 3 percentage points within six months. The latter condition was added in light of experience in 1987, when real money growth was falling fast but crossed below 3% only after the October crash.
Since the formulation of the rules was informed by historical evidence, their backtested performance is impressive by construction – see first chart. The additional return that would have been generated by following the rules over the last 48 years is identical, although their signals disagreed in 23% of months.

Both rules recommended equities between end-August 2011 and end-January 2018.
Six-month growth of G7 plus E7 real narrow money moved below that of industrial output in November / December 2017 – second chart. Allowing for the reporting lag, this resulted in the first rule switching into cash at end-January.

The second rule, however, remained in equities, since G7 annual real money growth was still at 5.8% in December 2017 and had fallen by only 1.2 percentage points from six months earlier – third chart.

The two rules have now reversed their recommendations. G7 annual real money growth crossed beneath the 3% threshold in May / June and is likely to have fallen further in July, based on US / Japanese monetary data. The July reading may also be down more than 3 percentage points from six months earlier. The second rule, therefore, switched to cash at end-July.
By contrast, the global economic slowdown and a stabilisation of monetary trends since early 2018 resulted in the gap between six-month growth of G7 plus E7 real narrow money and industrial output turning positive in May / June, causing the first rule to switch back into equities at end-July.
As noted in yesterday’s post, G7 plus E7 six-month real narrow money growth appears to have fallen in July, so this positive signal could prove short-lived. Using G7-only data, the growth gap has remained negative.
The historical backtest results, unsurprisingly, were most impressive when the two rules agreed. Dual positive signals were associated with an average excess return on equities relative to cash of 16.3% per annum (pa); equities underperformed cash by 10.3% pa on average when both rules were negative. Mixed signals, as currently, were associated with an average excess return of 1.6% pa. Even if unneeded, the opportunity cost of a defensive strategy may prove modest.
*A positive signal also requires the six-month change in real narrow money to be above zero.
Global monetary update: still weak
Six-month growth of real narrow money in the G7 economies and seven large emerging economies appears to have fallen back in July while remaining above its February low. As previously discussed, the stabilisation / small recovery in narrow money trends since February suggests that global economic momentum will bottom out in the fourth quarter of 2018 and revive slightly into early 2019. The July monetary set-back dampens expectations for such a revival.
The US, Japan, China, Brazil and India have released July monetary data, together accounting for two-thirds of the G7 plus E7 aggregate. With July consumer price data available for most countries, six-month growth of real narrow money is estimated to have fallen below its level over March-June, while holding above the February low – see first chart.

The monetary slowdown into February is now being reflected in hard economic data, with six-month industrial output growth at its lowest since 2016 in June.
Even at its June recovery high, six-month real narrow money growth was below the range between September 2008 and November 2017, suggesting weak economic expansion. Year-on-year growth, moreover, continues to slide – second chart.

A further fall in the six-month growth rate to below the February low would shift the central expectation here away from slowdown / late 2018 stabilisation in favour of sustained weakness and a possible 2019 recession.
The fall in global real narrow money growth between June and July was driven by the US, where the six-month change moved back into negative territory, matching the February low – third chart. As previously discussed, there has been some disagreement recently between the messages from the monthly M1 / M1A numbers and quarterly non-financial M1 but the assessment here for now is that US monetary trends are signalling a surprisingly sharp economic slowdown into early 2019. This assessment will be reviewed following release of sectoral monetary details for the second quarter in early September.

Chinese six-month real narrow money growth appears to have edged up in July, although the last data point in the chart could be revised slightly when full monetary details are released, probably later this week. With policy now being eased aggressively, monetary trends have probably bottomed but any revival is unlikely to be reflected in economic data until early 2019.
The final July reading of G7 plus E7 real narrow money growth will depend importantly on Eurozone data scheduled for release on 28 August.
China update: mixed monetary / leading indicator signals
The OECD this week released June data for its composite leading indicators. As expected, the G7 measure fell further, with the US component as well as the Japanese / European indicators now signalling below-trend economic growth – see first chart*. Even the OECD concedes that its indicators “are pointing tentatively to easing growth momentum”, contradicting the claim in the organisation’s May Economic Outlook that “global GDP growth is set to strengthen further in 2018-19”.

The OECD’s leading indicators are used here as a cross-check of the message from monetary trends, although the lead time of the indicators is shorter - usually four to five months versus around nine months for money. The fall in the G7 indicator is consistent with an earlier slowdown in G7 real narrow money, growth of which remains weak. As previously discussed, however, the OECD’s Chinese leading indicator has been giving a more positive message recently than narrow money trends. This divergence widened further in June, with the indicator suggesting that economic growth will pick up during the second half of 2018 – second chart.

Three possible explanations for the conflicting Chinese monetary / leading indicator signals are:
1) Surging use of mobile payments is boosting monetary velocity, i.e. current low narrow money growth does not imply weak economic prospects.
2) The leading indicator has become unreliable because of rapid structural economic change.
3) The leading indicator, unusually, has turned ahead of narrow money, i.e. growth of the latter will strengthen over coming months, confirming an improving economic outlook.
Explanation 2) is currently favoured here, suggesting retaining a cautious view of economic prospects, while recognising that uncertainty is higher than normal.
On 1), the argument is that the rapid adoption of mobile payments technology has been associated with a fall in households’ desired holdings of currency and demand deposits, i.e. each unit of narrow money now supports a higher level of economic activity.
Such a velocity shift, however, would be expected to play out over several years and is unlikely to explain a collapse in annual narrow money** growth from 22% in August 2016 to 6% in June 2018.
The fall in money demand, moreover, would be expected to be focused on currency holdings of households. Currency, however, accounts for only 9% of narrow money and its annual growth has been relatively stable – the narrow money slowdown has been driven by demand deposits. Deposits of non-financial enterprises, meanwhile, have slowed by more than those of households.
Explanation 2) is based on the idea that the components of the OECD’s Chinese leading indicator were suitable for an earlier stage of the country’s development but do not capture the shift away from investment- and export-led growth towards consumer spending.
The six components of the indicator are: steel production, motor vehicle production, building completions, production of chemical fertilisers, the export orders balance from the PBoC’s quarterly 5000 enterprise survey and stock market turnover. The weighting of hard production data is higher than for other OECD country indicators, while there is no gauge of consumer behaviour.
To assess whether the recent upturn in the leading indicator reflects its unusual composition, an alternative indicator was constructed attempting to mirror the components of the OECD’s US leading indicator. A reasonable Chinese equivalent measure was judged to be available for six of the seven US components, the exception being average weekly hours worked in manufacturing – see table.

The third chart compares the performance of the official and alternative indicators. The alternative version appears better aligned with economic developments in recent years: it rose strongly from end-2015 ahead of a pick-up in growth in late 2016 / early 2017 and has been signalling trend or slightly below-trend expansion more recently.

The alternative leading indicator is giving a more positive message for economic prospects than narrow money trends but the divergence is much less pronounced than for the official indicator.
Explanation 3) for the conflicting monetary / leading indicator signals is that the usual timing relationship between the two has reversed. On this view, monetary trends should improve soon to confirm the stronger message from the leading indicator. As previously discussed, recent interest rate falls suggest a recovery in narrow money growth but the timing and magnitude are uncertain – fourth chart.

As noted, explanation 2) is currently favoured here, but 3) is preferred to 1). This assessment will be revised as necessary in light of incoming monetary and leading indicator data – starting with July money numbers scheduled to be released in the coming week.
*The indicators are expressed in trend-adjusted form, i.e. a rise signals above-trend economic growth.
**Narrow money = true M1 = currency plus demand deposits of households, non-financial enterprises and government organisations.

