Entries from August 1, 2017 - August 31, 2017
UK monetary trends: inflation squeeze abates
UK monetary trends have weakened over the past year but are probably consistent with GDP growth of close to trend.
The narrow non-financial M1 measure rose by 0.4% in July from June*. Annual growth slipped further to 7.2% but remains above a low of 6.6% reached in 2015 and is not far short of equivalent Euroland expansion of 8.8% – see first chart.

The broader non-financial M4 measure rose by 0.2% in July, while annual growth subsided to 4.4% – equal to a February 2015 low but close to Euroland non-financial M3 expansion of 4.6%.
Non-financial M4 understates broad liquidity expansion at present because it excludes holdings of National Savings and foreign currency deposits, which have been rising strongly – by 10% and 23% respectively in the year to July. Annual growth of an expanded aggregate – “non-financial M4+” – including these two items was 5.6% in July and has fallen by less than that of other measures over the past year.
The strong increase in foreign currency deposits may partly reflect companies switching out of sterling deposits to protect against further exchange rate weakness.
While nominal money expansion remains respectable, real-terms growth has been squeezed by higher inflation. The six-month rate of change of seasonally-adjusted consumer prices, however, subsided in June / July, driving a small recovery in six-month real money growth, in turn suggesting that economic prospects have improved at the margin – second and third charts.


The Bank of England's preferred broad aggregate, M4ex, has slowed more sharply than non-financial M4 over the past year – fourth chart. M4ex also excludes National Savings and foreign currency deposits but includes money holdings of “non-intermediate other financial corporations” – annual growth of such deposits plunged from 20.9% in April to 4.8% in July. This reflects unusually large monthly increases over May-July 2016 dropping from the calculation and is unlikely to have any implication for economic prospects.

*Non-financial = held by households and private non-financial corporations. M1 = notes / coin plus sterling sight deposits. M4 = M1 plus sterling time deposits, bank securities of up to five years’ original maturity and repo claims on banks.
Euroland monetary trends cooling
Euroland July money numbers were weak, suggesting that economic prospects are deteriorating at the margin.
Non-financial M1 – the monetary measure with the strongest historical forecasting record, according to ECB research – was unchanged in July from June, while the broader non-financial M3 aggregate fell by 0.1%*.
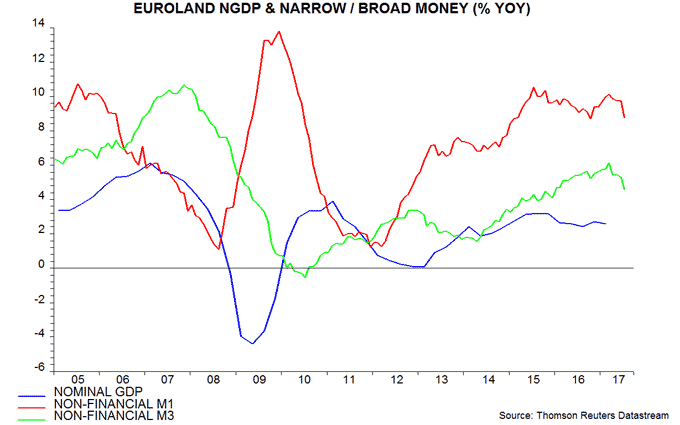
Annual non-financial M1 growth of 8.8% in July was the lowest since October 2016; non-financial M3 growth of 4.6% was the lowest since December 2015 – see first chart.
Six-month growth of the two aggregates has plunged since March: the declines between March and July were the largest over a four-month period since 2010 – second chart.
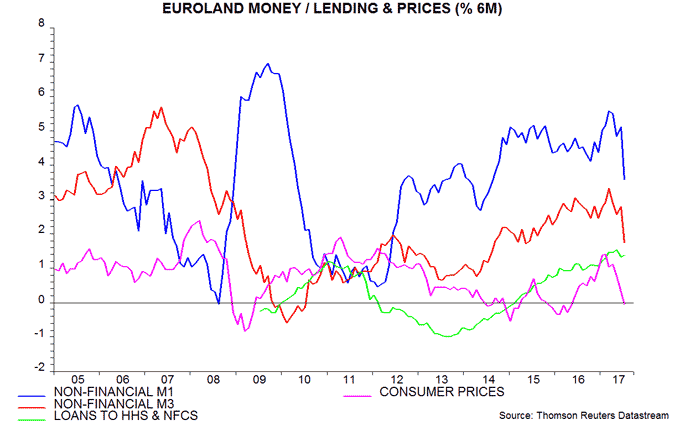
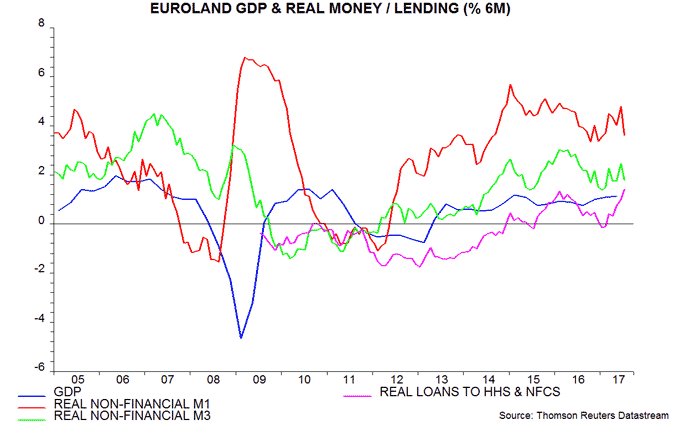
The impact on six-month real money expansion has been cushioned by a parallel sharp slowdown in headline consumer prices, reflecting the unwinding of a boost from energy and food prices in late 2016 / early 2017 – second and third charts. Real money growth, however, has pulled back sufficiently to suggest a slowing of economic momentum in late 2017 / early 2018. Six-month inflation, moreover, is likely to rebound, so real money trends may weaken further.
The headline M1 and M3 measures have slowed by less than the non-financial aggregates tracked here, reflecting relative strength in money holdings of financial corporations. Such holdings, however, are of little relevance for judging near-term prospects for spending on goods and services.
Six-month real narrow money growth was higher in Euroland than the US in late 2016, signalling superior Euroland economic prospects. The gap closed in May and the US was back ahead in July – fourth chart.

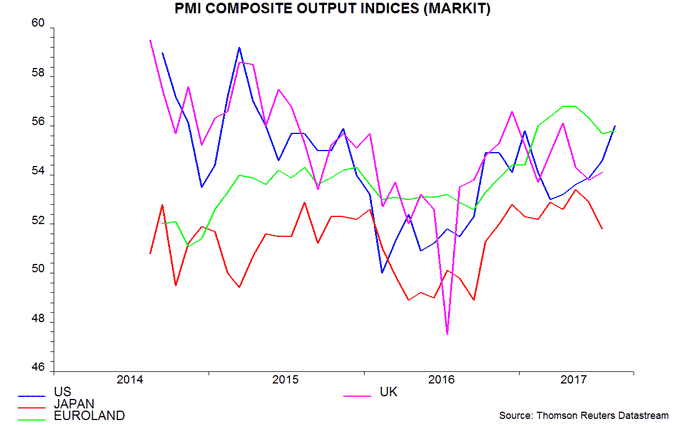
August PMIs are consistent with the forecast that the US will resume growth leadership: the US composite output index rose to its highest since May 2015, overtaking the Euroland index – fifth chart.
*Non-financial = held by households and non-financial corporations.
UK economy stronger into mid-year, reflecting services
UK GDP grew by 0.3% in the second quarter, unrevised from last month’s preliminary estimate, but monthly output figures indicate a recovery in momentum through the quarter, suggesting stronger third-quarter expansion.
The 0.3% second-quarter rise reflected growth of 0.5% (0.54% before rounding) in services output, which accounts for 79% of GDP. Industrial and construction output weakened slightly last quarter.
The demand breakdown shows that GDP growth was driven by a rebound in inventories after first-quarter destocking along with a solid increase in public spending (both consumption and investment) and modest private consumption expansion. Business investment was flat both on the quarter and from a year earlier.
Monthly output data indicate that GDP was unchanged from its first-quarter level in April but rose by 0.2% and 0.4% respectively in May and June, reflecting services strength – see first chart. The June level was 0.35% above the second-quarter average, implying significant “carry-over” to the third quarter.
Slower GDP growth in the first half followed a fall in six-month real non-financial M1 expansion from a peak in June 2016 – second chart. Real narrow money growth bottomed in April and recovered in June, suggesting improving prospects for late 2017 / early 2018; July monetary data will be released on 30 August. 
Data revisions confirm higher UK saving ratio
A post in December argued that official figures were understating the UK household saving ratio, probably reflecting an underrecording of income. It presented an alternative saving ratio measure based on data on capital / financial asset accumulation and borrowing – this averaged 9.0% over 2010-15 versus 8.0% for the official measure.
The Office for National Statistics this week gave a preview of revisions to be included in the national accounts annual update on 29 September. The new figures show the saving ratio averaging 9.3% over 2010-15 – higher even than the alternative measure calculated here (although this may also change significantly when the full new data set is released). The upward revision mainly reflects a correction of previous underrecording of self-employment income.
The chart shows the official saving ratio measure before and after the revision, together with the alternative measure. Revised numbers are not yet available beyond 2015 – a key issue is whether the sharp decline in the old official series in 2016-17 will be mirrored in the new data. The alternative measure is currently shown as rising in 2016.
A reasonable provisional conclusion, pending the 2016-17 revised data, is that household finances are stronger than previously indicated, implying a smaller risk of a significant consumer spending downturn.
The upward revision to self-employment income may also have implications for the MPC’s assessment of labour cost pressures. Monthly average earnings numbers cover employees only. To the extent that higher-earners have switched to self-employed status, extracting income through corporate structures, the average earnings series may understate growth of compensation per person across the employed population as a whole. It should be possible to estimate the size of any such effect when the new data set is released.
US inventory cycle turning positive
The view here that US economic growth will outpace consensus forecasts in late 2017 / early 2018 is based partly on the expectation of a significant contribution from the inventory cycle.
The Kitchin inventory cycle usually plays out over three to five years, with upswings lasting at least 18 months. Cycle lows are judged here to have occurred in 2009, 2012 and 2016.
Upswings follow a three-step pattern*, involving an initial burst of strength (A) followed by a pull-back (B) and final surge (C) into the cycle top.
The blue line in the chart shows the contribution of the change in inventories to two-quarter GDP growth. The contribution was negative for five quarters ending in the third quarter of 2016, consistent with a cycle low having been reached in 2016.
The growth contribution was positive in late 2016 but turned negative again in the first half of 2017. Steps A and B of the upswing, therefore, may have been completed, with the C boost scheduled to begin.
This interpretation is supported by an analysis of the inventories to sales ratio. The red line in the chart shows the two-quarter change in the ratio, plotted inverted. A rise in the ratio is usually followed by firms cutting the rate of increase or level of inventories, resulting in a negative growth contribution (and vice versa). The ratio fell sharply during the first half of 2017, suggesting that firms were surprised positively by final sales and supporting the expectation of significant restocking over the next several quarters.
*See Tony Plummer, Forecasting Financial Markets.
The UK's term funding scheme should be closed now
The MPC used the August Inflation Report to signal that it judges the market’s view of interest rate prospects to be too dovish. The market ignored the signal. One reason may be that the MPC’s stated view is being contradicted by a continued injection of liquidity via the term funding scheme.
Launched in August 2016, the scheme allows banks to borrow cheaply from the Bank of England for up to four years. The initial terms stated that the scheme would remain open at least until end-February 2018. The MPC this month decided not to extend it beyond this date.
Borrowing under the scheme has risen further from £69.3 billion at end-June to £80.4 billion, according to a weekly tally posted on the Bank’s website.
The Bank funds the scheme by creating new bank reserves. Total reserves, therefore, have continued to expand despite gilt and corporate bond purchases ending in March and April respectively – see chart.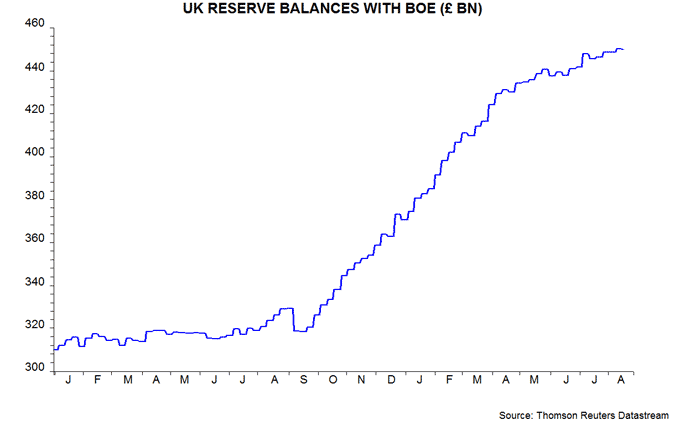
A Sunday Times report claimed that “the cash has been used by banks to fund the surge in credit card lending and in unsecured personal loans”. This is misleading. For banks in aggregate, borrowing under the scheme has been matched by increased reserve holdings – the cash, in effect, has flowed back to the Bank of England.
By boosting liquidity and reducing banks’ need to compete for funds, however, the scheme has put downward pressure on deposit and lending rates. Lower lending rates, in turn, are likely to have stimulated credit demand.
The Bank’s critics, therefore, are justified in complaining that it is pursuing contradictory policies, i.e. warning of future rate rises and taking steps to discourage certain forms of lending while simultaneously providing additional “stimulus” via the term funding scheme.
A key mistake was to commit to an 18-month “drawdown window” when the scheme was launched – another example of the perils of “forward guidance”.

