
Entries from April 1, 2023 - April 30, 2023
Moderate Chinese recovery won't offset weakness elsewhere
 Simon Ward
 1 Comment
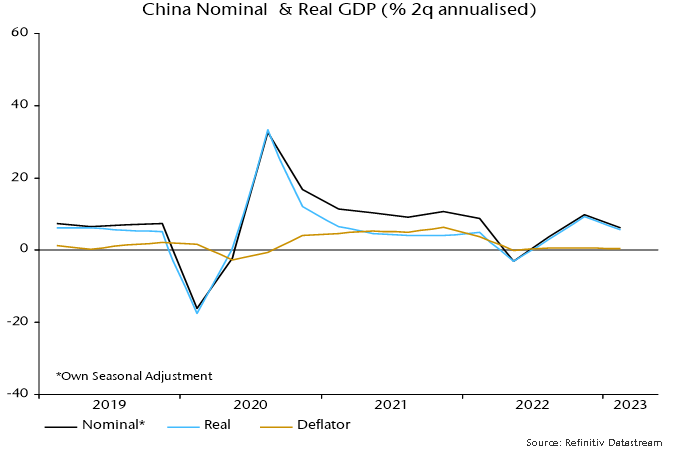
The Chinese economy has bounced back since reopening but the pick-up has arguably been underwhelming. GDP grew at a 9.1% annualised rate in Q1, according to official data, but this partly represents payback for a weak Q4. Growth averaged an unexceptional (by Chinese standards) 5.7% over the two quarters.
Inflationary pressures remain weak despite the activity rebound. Nominal GDP expansion was only marginally higher than real in Q4 / Q1 combined: the GDP deflator rose by just 0.4% annualised – see chart 1*.
Chart 1
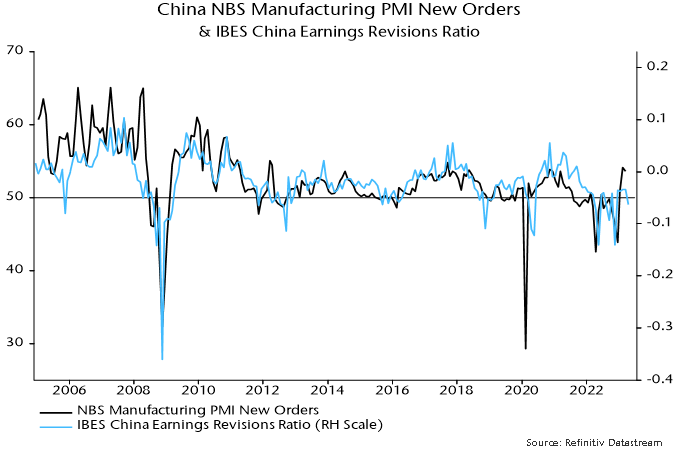
Muted nominal GDP growth has contributed to lacklustre profits, with the IBES China earnings revisions ratio diverging negatively from recent stronger official PMIs, questioning the sustainability of the latter – chart 2.
Chart 2
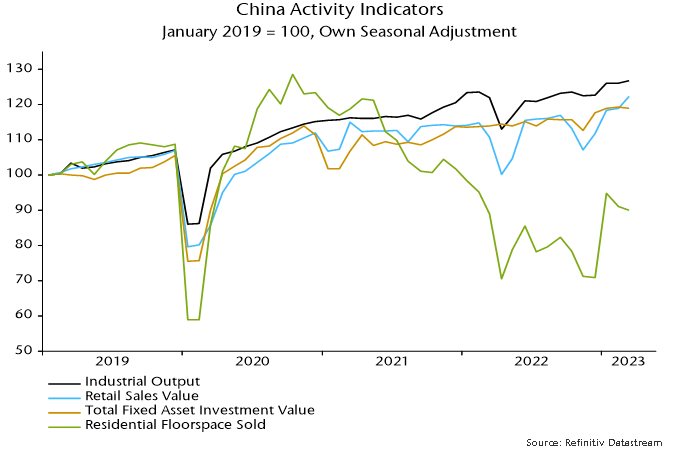
Monthly activity numbers for March were mixed and don’t suggest a pick-up in momentum at quarter-end. Retail sales were a bright spot but strength in industrial output, fixed asset investment and home sales has faded after an initial reopening bounce – chart 3.
Chart 3
Moderate nominal GDP expansion is consistent with recent narrow money trends: six-month growth of true M1 (which corrects the official M1 measure to include household demand deposits) remains range-bound and slightly below its 2010s average – chart 4**.
Chart 4
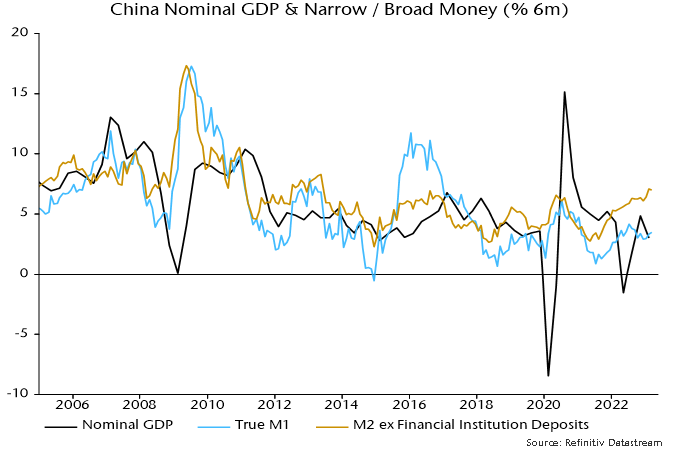
Broad money growth, as the chart shows, is significantly stronger. However, examination of the “credit counterparts” indicates that a rise since late 2021 has been driven mainly by banks switching to deposit funding and reducing other liabilities – domestic credit expansion has been stable.
The judgement here is to place greater weight on narrow money trends, which currently suggest a moderate recovery that probably requires additional policy support to offset external headwinds.
*Official unadjusted nominal GDP seasonally adjusted here; GDP deflator derived from comparison with official seasonally adjusted real GDP.
**March true M1 estimated pending release of demand deposits data.
Global supply glut signalling goods deflation
The “monetarist” forecast is that G7 inflation rates will fall dramatically into 2024, mirroring a collapse in nominal money growth in 2021-22.
G7 annual broad money growth returned to its pre-pandemic (2015-19) average of 4.5% in mid-2022. Based on the rule of thumb of a two-year lead, this suggests that annual inflation rates will be around pre-pandemic levels in mid-2024. More recent broad money stagnation signals a likely undershoot.
Pessimists argue that inflation will prove sticky because of high wage growth. Wages are a coincident element of the inflationary process. Low (but rising) wage growth didn’t prevent the 2021-22 inflation surge and high (but moderating) growth isn’t an obstacle to a substantial fall now.
The 2021-22 inflation surge was initially driven by excess demand for goods, due to a combination of covid-related supply disruption, associated precautionary overbuilding of inventories, a spending switch away from services and – most importantly – excessive monetary / fiscal stimulus.
Excess goods demand was reflected in a plunge in the global manufacturing PMI supplier delivery speed index to a record low. This plunge predated the inflation surge by about a year versus a two-year lead from money – see chart 1.
Chart 1

The reverse process is now well-advanced, with supply normalising, firms running down excess inventories, the services spending share rebounding and monetary policies far into overrestrictive territory. The PMI delivery speed index is at its highest level since the depths of the 2008-09 recession, signalling substantial excess goods supply.
Global goods prices are heading into deflation. Chinese reopening has added to excess supply and Asian exporters are already lowering prices in the US – chart 2. Chinese producer prices are falling and the renminbi is competitive, with JP Morgan’s PPI-based real effective rate at its lowest level since 2011. Other Asian currencies are similarly weak.
Chart 2

The global manufacturing PMI output price index lags and correlates negatively with the delivery speed index. It has plunged from 64 to 53 and is likely to cross below 50 soon. The current prices received balance in the US Philadelphia Fed manufacturing survey turned negative (equivalent to sub-50 in PMI terms) in April, the weakest reading since the 2020 recession.
Global goods deflation will squeeze profits and wage growth in that sector, with knock-on effects on services demand, pay pressures and pricing.
Central bankers are once again asleep at the wheel, pursuing procyclical polices that amplify economic volatility and impose unnecessary costs.
Recession warning from US vacancies
US February job openings were 17% below their March 2022 peak. Historically, a decline of this magnitude in vacancies – job openings or, for earlier years, help-wanted advertising – was always associated with a payrolls recession.
Job openings numbers are available back to 2000. Regis Barnichon, now at the San Francisco Fed, constructed a proxy series – composite help-wanted advertising – for earlier decades. The Barnichon series adjusts historical data on newspaper advertising for a rising share of online job postings, modelled by an S-curve.
The official and Barnichon series (which is no longer updated) can be spliced together to create a continuous vacancies series extending back to the early 1950s, a period encompassing 11 recessions involving sustained payrolls declines – see chart 1.
Chart 1

Every payrolls decline was preceded by a fall in vacancies but several vacancies declines were followed by slowdowns in payrolls rather than outright weakness (e.g. 1966).
A sufficient condition for a payrolls recession was a fall of more than 15% in vacancies from their peak level in the latest 12 months – chart 2. This condition was met in February job openings numbers released last week.
Chart 2

Historically, the 15% threshold was reached around the time that payrolls started to decline. In six of the 11 cases, payrolls had already peaked, although this was not always known at the time.
As an example, current data show a 1974 payrolls decline beginning in August, one month before the vacancies fall reached the 15% trigger. In real-time data, however, a payrolls peak was delayed until October.
Global monetary relapse ominous for H2 prospects
Partial information indicates that global (i.e. G7 plus E7) six-month real narrow money momentum fell for a third month in March, possibly breaching a low reached in June 2022. This increases confidence that a recent recovery in PMIs will reverse into H2.
The June 2022 low in real narrow money momentum presaged a low in global manufacturing PMI new orders in December – see chart 1. Assuming the same six month lead, the roll-over in real money momentum since December 2022 implies a PMI decline from June.
Chart 1

The fall could start earlier. The recovery in real money momentum between June and December 2022 was minor and driven entirely by a slowdown in six-month consumer price inflation. Momentum failed to break into positive territory. Credit tightening due to recent banking stresses may accelerate economic weakness.
The renewed fall in global real money momentum since December reflects nominal money weakness rather than any inflation rebound: the six-month rate of change of nominal narrow money appears also now to be negative, a feat never achieved during the GFC – chart 2.
Chart 2

Nominal money contraction is being driven the US and Europe, with momentum positive and stable in the E7 and Japan.
Global real money momentum will be supported by a further inflation slowdown but a significant recovery is unlikely without a policy reversal that revives nominal money growth. As previously argued, recent reexpansion of the Fed’s balance sheet has no direct – or, probably, indirect – impact on money stock measures.
The fall in global real money momentum has further delayed the expected cross-over above weakening industrial output momentum, suggesting fading the Q1 equity market rally and favouring defensive sectors, quality and yield.
A "monetarist" perspective on current equity markets
Global economic sentiment has improved on the back of China’s reopening and a collapse in the European gas price but monetary indicators continue to signal a negative outlook. The “excess” money backdrop remains unfavourable for equity markets, with prospective developments suggesting overweighting non-energy defensive sectors and expecting a further relative recovery in quality / growth.
Revisions to US seasonal adjustments have slightly altered the recent profile of global (i.e. G7 plus E7) six-month real narrow money momentum – the key leading indicator in the money / cycles forecasting approach used here. On the new numbers, momentum bottomed in June 2022, recovering modestly into December before falling back in January / February – see chart 1.
Chart 1

The June turning point has been followed – with a lag within the normal range – by a recovery in global manufacturing PMI new orders from a low in December, with the revival driven by a sharp rise in the Chinese component.
The PMI recovery is expected to fizzle out and reverse into H2, for both monetary and cycle reasons. Six-month real narrow money momentum, as noted, fell back in January / February and remains in negative territory – a sustained economic / PMI recovery has never occurred historically against such a monetary backdrop.
From a cycles perspective, major PMI lows occur around troughs in the stockbuilding cycle but the current downswing phase was only starting when PMI new orders bottomed in December. With the last cycle trough in Q2 2020, the average historical cycle length of 3 1/3 years suggests another low in H2 2023.
The marginal recovery in global six-month real narrow money momentum since June 2022 has been driven entirely by China and several other E7 economies. US / European momentum has slid deeper into negative territory as already restrictive monetary policy settings have been tightened further – chart 2.
Chart 2

The Chinese pick-up suggests economic acceleration through 2023 but a recovery will be held back by – and won’t offset – global weakness. Current Chinese real money strength, moreover, could fade: higher short-term rates / yield curve flattening since late 2022 suggest a slowdown in nominal money growth while unusually low inflation may revive as the economy normalises.
The assessment of market prospects relies on two indicators of global “excess” money – the gap between six-month real narrow money and industrial output momentum, and the deviation of year-on-year real money momentum from a long-term moving average. The signs of the two indicators define four investment quadrants describing different market environments – see table 1. (This presentation echoes Hedgeye’s investment “quads”, in their case defined by the directions of economic growth and inflation – the approach here offers an alternative “monetarist” perspective.)
Table 1

The two indicators were negative from January 2022 (allowing for reporting lags) through year-end but the last quarterly commentary suggested that the first measure would turn positive in early 2023 as weakening industrial output momentum crossed below stable or rising real money momentum. Based on historical patterns, the implied shift from the bottom right to top right quadrant might be associated with less negative equity markets and a reversal of some of last year’s sector / style moves, including relative recoveries in quality / growth and tech – table 2.
Table 2

The suggested sign switch of the first indicator had not occurred by January – chart 3 – but markets appeared to front run the quadrant shift in Q1, with tech / growth outperforming strongly and energy / financials weak. A cross-over of six-month industrial output momentum below real money momentum is still expected here, although timing is uncertain – Chinese reopening has delayed industrial weakness. Some Q1 moves were extreme so it may be advisable to await confirmation before adding to favoured themes.
Chart 3

A common characteristic of the right hand quadrants of the table is a trend of non-energy defensive sectors outperforming non-tech cyclical sectors. The reverse occurred during Q1, although much of the cyclical relative gain unwound later in the quarter as financials were pummelled by banking crises. With no early move to the left hand of the table in prospect, an overweighting of non-energy defensive sectors – along with quality, which also usually outperforms in both right hand quadrants – is suggested.
The stark contrast between positive and rising E7 six-month real narrow money momentum and faster contraction in the G7 raises the question of whether investors should overweight EM equities. Over 1990-2022, EM equities outperformed developed markets by 3.2% pa on average when the E7 / G7 real money momentum gap was positive, underperforming by 6.1% when it was negative.
Further investigation, however, indicates that a positive gap is a necessary but not sufficient condition for EM outperformance – the global “excess” money backdrop, in addition, needs to be taken into account. Table 3 shows that, since 1990, EM equities have outperformed on average only when both the E7 / G7 gap and the first global excess money indicator were positive. Confirmation of a sign change in the latter indicator would strengthen the case for overweighting EM.
Table 3

Historically, periods of sustained EM outperformance coincided with trend declines in the US dollar. The dollar reached major peaks in 1969, 1985 and 2002. These peaks occurred 6-7 years before housing cycle lows (in 1975, 1991 and 2009). Assuming a normal (i.e. c.18 year) cycle length, another cycle low is scheduled for the late 2020s. A dollar peak in October 2022, therefore, may turn out to be a major top, preceding a trend decline into or beyond the housing cycle trough.
