
Entries from April 1, 2022 - April 30, 2022
G7 money trends promising 2023-24 inflation relief
 Simon Ward
 3 Comments
March CPI numbers globally have mostly surprised on the upside (again) but monetary trends and other considerations continue to suggest significant relief in 2023-24.
G7 annual CPI inflation rose to 6.8%* in March, the fastest since 1982.
A post in September 2020 presented a “monetarist” forecast that G7 inflation would average 4-5% pa in 2021-22, i.e. between Q4 2020 and Q4 2022. Money growth in H2 2020 / 2021 was faster than assumed in the post and an outturn in the 5-5.5% range is now likely. (Annual CPI inflation was 4.9% in Q4 2021 and a retreat from the current level is likely over the remainder of 2022, partly reflecting commodity price base effects.)
The current inflation surge reflects a money growth surge in 2020 – G7 annual broad money growth* rose from 6.2% in February 2020 to 16.9% by June, eventually peaking at 17.3% in February 2021. This increase has now almost fully reversed, with annual growth estimated to have fallen below 7% in March – see chart 1.
Chart 1

Three-month annualised growth is down to about 4%, close to its average in the five years before the pandemic – chart 2.
Chart 2

Broad money growth has slowed by much more than after a comparable surge in the early 1970s. Annual money growth then bottomed above 10% before rebounding strongly, resulting in inflation remaining high and reaching a second peak in 1980.
Sustained broad money expansion of 4% would be consistent with inflation rates returning to target, though possibly not until 2024.
Will money growth stage a 1970s-style rebound? As previously discussed, this was triggered by monetary policy-makers abandoning restraint as economies weakened. Central bankers only recently shifted hawkishly and the hurdle for a policy U-turn is high.
The broad money slowdown partly reflects the winding down of QE, suggesting further weakness if QT plans are implemented. The proposed reduction of $95 billion per month in the Fed’s securities holdings is the equivalent of 0.35% of US broad money. The actual negative impact will be smaller because of various leakages, e.g. Fed disposals are likely to be partly absorbed by an increase in holdings of commercial banks (relative to a no QT scenario), implying a neutral effect on broad money. A reasonable assumption is a “multiplier” of 0.5, i.e. a drag on US broad money of 0.175% per month, or 2.1% over a year. This would cut 1.1 pp from G7 annual broad money growth.
With central bank actions on course to exert a negative impact, a rebound in money growth depends on “endogenous” strength in bank lending to the private sector. Monetary economists continue to debate this prospect. “Bulls” note a significant lending pick-up in recent months: G7 annual loan growth, adjusted for US PPP disbursements / forgiveness, was an estimated 6% in March, faster than in any month over 2009-2019. The suspicion here is that strength partly reflects the stockbuilding cycle, which is peaking, while recent yield rises will curb housing credit demand.
Central bank loan officer surveys are useful for gauging the outlook. The next Fed survey is due in early May but the ECB poll released last week signalled both a tightening of credit standards and weaker demand, suggesting that a recent pick-up in loan growth will reverse – chart 3.
Chart 3

The monetary forecast of 2023-24 inflation relief is supported by the assessment that the stockbuilding cycle is about to enter a 12-18 month downswing. The cycle is correlated with industrial commodity price momentum, which appears to have peaked – chart 4. Supply issues may constrain the downside but the wedge between G7 annual headline and core (i.e. ex. food and energy) inflation – currently 2.5 pp – is likely to narrow significantly in H2 2022 and may turn negative in 2023.
Chart 4

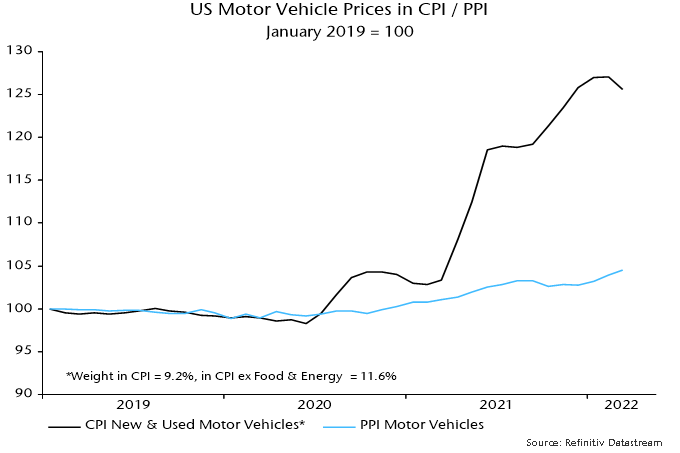
A “technical” factor promising CPI relief is a prospective reconvergence of consumer and producer prices of vehicles when supply constraints eventually ease. In the US, the CPI for motor vehicles would have to fall by 17% to eliminate a post-pandemic divergence with its PPI equivalent – chart 5. A PPI pick-up may bear part of the adjustment but the CPI vehicles index could plausibly decline by 10%, implying a 0.9% drag on headline CPI. A smaller but still meaningful effect is likely elsewhere.
Chart 5
*Own calculation using GDP weights.
A "monetarist" perspective on current equity markets
The monetary indicators followed here continue to give a negative signal for the global economy and risk assets. The indicators have been depressed by an inflation squeeze on real money balances and this drag is probably peaking. Any relief, however, may be offset by a further slowdown in nominal money growth due to over-aggressive withdrawal of stimulus by belatedly hawkish central banks.
Global equities relinquished all of their Q4 gain in early 2022 and fell to new lows following Russia’s invasion of Ukraine. As is often the case with responses to “news”, the latter move was subsequently reversed fully, with markets recovering strongly into late March. The monetary backdrop is not conducive to an extension of this rally.
Two measures of global “excess” money are tracked here – the differential between six-month growth rates of real narrow money and industrial output and the deviation of 12-month real money growth from a slow moving average. A previous post in this series at the start of the year noted that the second measure had turned negative and the first was likely to follow (confirmed in January). Historically, global equities underperformed cash on average when either measure was negative, with the weakest returns under “double-negative” regimes.
Could the measures return to positive territory soon? Chart 1 shows the components of the first gauge. The low level of global six-month real narrow money growth mainly reflects current high consumer price momentum – nominal money growth is only slightly below its 2010-19 average. CPI momentum may be peaking with commodity prices but the relationship in chart 2 suggests no significant relief until H2.
Chart 1

Chart 2

The negative gap between real money and industrial output growth also reflects a recent rebound in the latter as production constraints have eased and firms have rebuilt inventories. This will likely reverse – the real money slowdown suggests economic weakness and the stockbuilding cycle is scheduled to turn down. Again, however, a sufficient fall in output momentum may be delayed until H2.
The second excess money measure – the deviation of 12-month real narrow money growth from a moving average – is likely to remain negative for longer than the first, with 12-month inflation relief delayed until late 2022.
Chart 3

Both measures, moreover, could be depressed by a further slowdown in nominal money growth in response to recent and prospective central bank tightening – chart 4.
Chart 4

As well as performing poorly on average, equity markets have historically displayed distinct sector and style trends under double-negative excess money signals. Specifically, tech and other cyclical sectors (as defined by MSCI) underperformed on average, while energy and other defensive sectors outperformed. This pattern was evident during Q1.
Style-wise, high dividend yield and quality have outperformed on average under double-negative signals. The shift to an unfavourable environment has also often been associated with a set-back for momentum. So far, yield has outperformed but quality has lagged. This may reflect higher-than-usual exposure to tech and momentum in the quality basket, as well as the negative correlation of the style with long-term bond yields.
The Q1 surge in yields had not been expected here and occurred mostly after Russia’s invasion of Ukraine – the 30-year Treasury yield had remained below its March 2021 peak until the shock. The key drivers appear to have been stronger commodity prices – and an associated rise in inflation expectations – and a surprisingly aggressive hawkish policy shift by the Fed, mirrored to a lesser degree by other central banks.
The expected downswing in the stockbuilding cycle will weaken demand for commodities, offsetting the Russia / Ukraine supply shock and probably allowing price momentum to slow, if not turn negative. Central banks, meanwhile, usually abandon policy tightening plans as the downswing unfolds. The rise in Treasury yields, therefore, is judged unlikely to extend and may reverse, in turn suggesting that quality will resume its usual defensive status in negative monetary environments.
Medium-term interest rate prospects, of course, hinge on the issue of whether current inflation will prove “transitory”. “Monetarist” economists warned that the 2020 surge in global nominal money growth would feed through to a major inflation pick-up in 2021-22. Current money trends, however, are reassuring: G7 annual broad money growth has fallen significantly and the rate of increase in the latest three months was close to the pre-covid average – chart 5.
Chart 5

Will money growth rebound? It seems unlikely unless central banks completely abandon tightening plans and revert to zero rates and quantitative easing (QE). If quantitative tightening (QT) goes ahead, maintenance of even the recent slower pace of money growth will require solid expansion of bank lending. G7 monthly loan growth picked up into late 2021 but this is judged partly to reflect temporary inventory financing. Central bank lending surveys suggest moderate demand and were conducted before recent yield rises.
Regional / country money trends suggest particularly weak economic prospects in the Eurozone and UK, where six-month changes in real narrow money are negative – chart 6. The US could follow in March as CPI momentum rises further. Relative strength in Japan / China is due to a smaller inflation drag. Australia is a rare case of money trends still giving a positive economic signal.
Chart 6

A revival in Chinese real money growth from mid-2021 was, as expected, reflected in stronger activity data in early 2022. The economic recovery, however, has been stalled by renewed covid outbreaks and exports are at risk from global weakness. The hope here was that policy easing would lead to a more significant pick-up in nominal money growth by now. A reversal of food price weakness, meanwhile, suggests a rising inflation drag on real money growth.
