Entries from April 1, 2018 - April 30, 2018
Global leading indicators confirming monetary slowdown signal
The monetary forecast of a global economic slowdown over the remainder of 2018 is receiving confirmation from shorter-term non-monetary leading indicators.
A March update of the widely-monitored OECD composite leading indicators is scheduled for release on 14 May. Most of the component data, however, are already available, allowing an independent calculation.
The first chart below shows the G7 normalised indicator together with the independently-calculated series, which includes a March estimate and incorporates revisions. The series levelled off in January / February and fell in March. The normalised indicator is designed to signal turning points in the level of output relative to trend, i.e. the March decline suggests future below-trend expansion

The recent reversal in the indicator has been driven by Japan and Europe, with the US component still rising – second chart.

Available evidence suggests that global (i.e. G7 plus E7) six-month industrial output growth reached a seven-year high in March – third chart. Previous posts suggested that a peak would be reached around March, based on a peak in six-month real narrow money growth in June 2017 – the average lead time at turning points historically has been nine months. The chart shows six- and one-month rates of change of a trend-restored G7 plus E7 leading indicator derived from the OECD data. Six-month growth peaked most recently in November 2017; the average historical lead time has been four months, so this is also consistent with a fall in six-month output growth after March. With one-month growth of the indicator still weakening, a further fall in the six-month increase is likely.

The OECD composite leading indicators incorporate a mixture of soft data (business and consumer surveys), hard series (e.g. housing starts / permits, manufacturing new orders, auto registrations / output, average / overtime hours, the ratio of manufacturing inventories to sales) and financial market indicators (e.g. the slope of the yield curve, stock prices). Of the G7 plus E7 countries, only the indicators for Canada and India include a monetary aggregate (M1). The indicators, therefore, provide an independent, though less timely, cross-check of monetary signals.
Is the global economy facing "slowflation"?
Previous posts expressed concern that a global economic slowdown during 2018 would be accompanied by a rise in inflationary pressures, constraining central banks’ ability to provide policy support for weakening markets. Recent inflation news provides some support for this view.
G7 headline and core (i.e. ex. food and energy) consumer price inflation rose in March, with the core rate reaching the top of its post-GFC range, matching highs in 2012 and 2016 – see first chart.

The recent core rise has been driven by the US and Japan. The US increase partly reflects the dropping-out of last year’s large cut in mobile data charges. In addition, shelter inflation, which was also a drag in 2017, recovered to a seven-month high in March – shelter has a 41% weight in the core basket and is dominated by actual and imputed rents.
Upward pressure on rents is suggested by the low level of the rental vacancy rate, which fell in the fourth quarter of 2017, with a first-quarter figure to be released tomorrow – second chart.

Shelter inflation has also displayed a lagged relationship historically with house price inflation, which has continued to pick up – third chart.

Our start-of-year commentary suggested that Chinese monetary policy would be eased during the first half of 2018, a development that “could give a further short-term boost to commodity prices, which would add to global inflation concerns”. Evidence continues to build of a policy reversal, with newswires yesterday reporting that an “informed source” expects a further cut in banks’ reserve requirement ratios, following last week’s surprise reduction.
The fourth chart below shows the gap between G7 headline and core inflation along with the annual rate of change of the S&P GSCI commodity price index, with this rate of change projected forward assuming that the GSCI is stable at its current level. The relationship implies a widening of the gap near term, in turn suggesting that headline inflation will move above its February 2017 high, assuming stable core inflation.

Business surveys and equity analysts’ earnings revisions are consistent with a peak in economic growth – fifth chart – but consumer confidence measures remain elevated, giving rise to hopes that a slowdown will be modest and temporary. Higher inflation could contribute to a decline in consumer optimism.

UK inflation numbers have surprised on the downside in the last two releases but, as elsewhere, recent commodity price strength may lift the headline rate near term – sixth chart. As previously discussed, annual unit wage cost growth may have moved up to about 2.75% in the first quarter, while producer output price trends suggest a near-term reacceleration of core consumer prices – seventh chart.


Will Chinese policy easing work?
Satisfactory Chinese activity numbers for the first quarter / March are consistent with monetary trends in mid-2017. Subsequent monetary weakness, which continued in March, suggests a significant slowdown over the remainder of 2018. The authorities appear to be shifting tack to head off economic weakness. Late cycle policy easing can prove counter-productive by boosting prices, thereby exerting additional downward pressure on real money trends.
This week’s activity numbers were mostly solid, although annual industrial output growth fell to a seven-month low in March as an upward distortion from the late timing of the Chinese New Year unwound (discussed in a previous post).
Two-quarter growth of nominal GDP, seasonally adjusted, rose slightly further last quarter, consistent with a stabilisation / small recovery in six-month narrow money expansion in mid-2017 – see first chart.
Narrow money trends, however, weakened sharply after September, with six-month growth falling further in March to its lowest since January 2015, suggesting a significant loss of economic momentum alongside weaker inflationary pressures through late 2018.
Credit trends are also concerning: the percentage increase in the stock of “total social financing” in the first quarter, of 3.2%, was the lowest on record in data extending back to 2004.
The authorities, therefore, appear to be moving to ease policy. A fall in term interbank rates in early April suggested that a shift was under way and this week’s reduction in the reserve requirement ratio for a range of banks, involving a net increase in liquidity supply, offers confirmation.
Market perceptions of a Chinese policy turnaround may have driven this month’s recovery in risk assets and contributed to renewed strength in commodity prices.
As previously discussed, Chinese loosening, together with a recovery in US narrow money growth in lagged response to tax cuts, could result in a revival in the global real money growth measure tracked here. Late cycle policy easing, however, can be ineffective or even counter-productive, feeding directly into higher prices without boosting nominal money trends.
The US FOMC was not, as is sometimes claimed, asleep at the wheel in the run-up to the 2008-09 recession – it cut the fed funds target rate by 100 basis points between August and December 2007, with the US recession beginning in January 2008, according to the NBER. Policy easing, however, contributed to a surge in commodity prices that continued into mid-2008. This surge fed through into global consumer prices and, with nominal money trends remaining weak, was an important reason for the six-month change in real narrow money turning negative – second chart.
UK MPC on course for risky rate hike
UK labour market statistics confirm stronger wage cost pressures and suggest that the MPC will press ahead with another interest rate increase next month. The view here remains that the Committee should hold fire because of worryingly weak monetary trends.
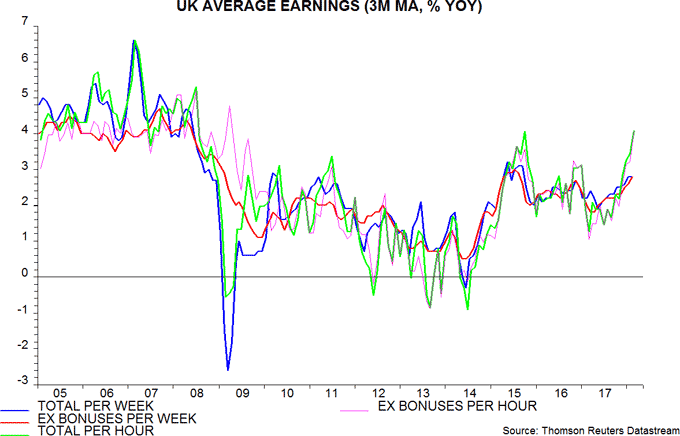
Annual growth of average weekly earnings, smoothed over three months, was unchanged at 2.8% in February and below a consensus forecast of 3.0%. The undershoot, however, reflected lower growth of bonus payments – the ex. bonuses measure moved up to 2.8%, the highest since 2015.
Hourly pay, moreover, is rising considerably faster because of a fall in average weekly hours worked over the last year. Hourly earnings growth, including or excluding bonuses, is estimated to have increased further to 4.0% in February, with the ex. bonuses measure the highest since 2009 – see first chart.

The recent acceleration of hourly earnings has outpaced a modest improvement in growth of productivity (i.e. output per hour), implying stronger unit wage cost expansion – second chart. Annual productivity growth rose to 1.0% in the fourth quarter of 2017 and may have increased slightly further in the first quarter, reflecting the dropping-out of a quarterly decline a year earlier. With hourly earnings growth at 4.0%, however, annual unit wage cost expansion may have moved up towards 3% last quarter, after 2.4% in the fourth quarter.

MPC concern about labour market overheating will be heightened by a further fall in the unemployment rate to 4.2% in the three months to February and 4.0% in February alone – below a forecast of 4.3% for the first quarter in the February Inflation Report.
Increased labour cost pressures support the view here that consumer price inflation will be slower to return to the 2% target than the MPC projected. As previously discussed, however, these pressures reflect past monetary and economic strength – current weak monetary trends suggest diminishing medium-term inflation risks, with narrow and broad money growing at annualised rates of only 1.6% and 1.1% respectively in the three months to February. A May rate hike would risk exacerbating this weakness.
Are global money trends stabilising?
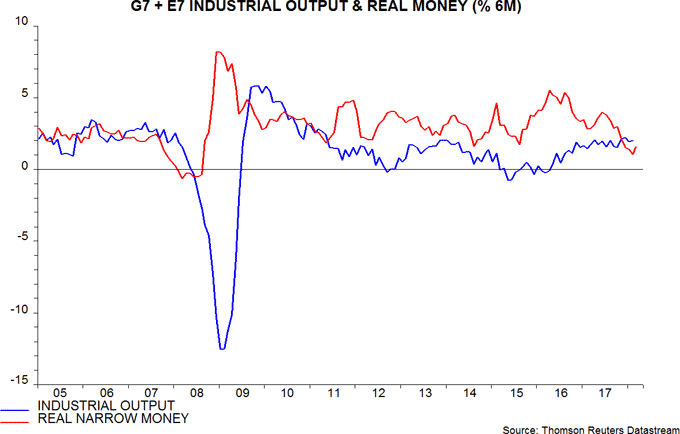
A further fall in global real narrow money expansion in early 2018 suggests that a recent slowdown in economic activity will be sustained until late in the year, allowing for the typical nine-month lead. Previous posts (e.g. here) discussed reasons for thinking that real narrow money trends would stabilise or recover from the first quarter, a development that would provide some reassurance about economic prospects for end-2018 / early 2019. Partial monetary data for March are consistent with this scenario.
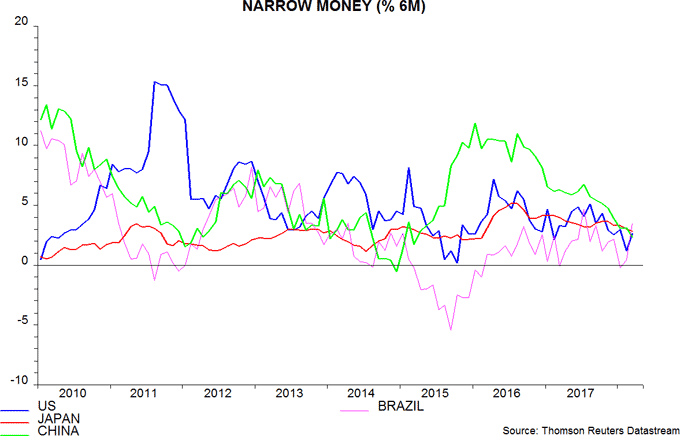
March monetary figures are available for the US, China, Japan and Brazil, together accounting for 60% of the G7 plus E7 aggregate tracked here. Assuming unchanged nominal money growth in the other economies, and taking into account March inflation data / forecasts, G7 plus E7 six-month real narrow money expansion is estimated to have returned to its December level, following February’s nine-year low. This would, however, still leave it below its range between September 2008 and November 2017 – see first chart.

The estimated March recovery reflects two factors: a rebound in US six-month nominal narrow money growth and a fall in the six-month rate of change of global consumer prices (seasonally adjusted).
As previously discussed, a rise in US narrow money growth into the third quarter of 2018 would fit the pattern after three previous large tax cuts. The Fed, as now, was raising interest rates as these tax cuts were enacted; the additional tightening implied by current and planned balance sheet contraction, however, could undermine the comparison. The weekly narrow money data fell back during March and will need to rebound in April to maintain alignment with the historical pattern.
Brazilian six-month narrow money growth also strengthened in March but Chinese and Japanese data were weak – second chart.

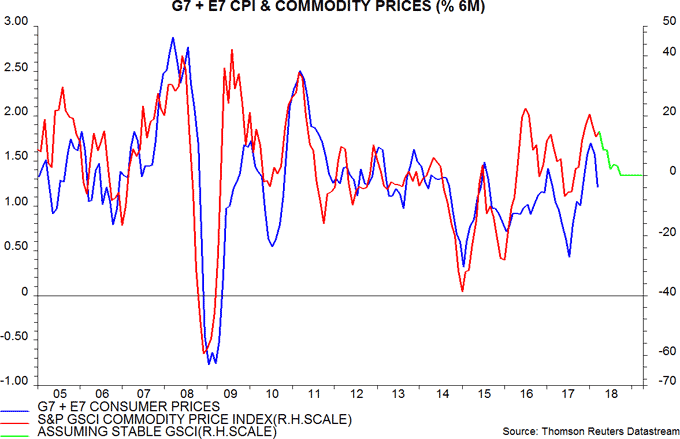
A fall in six-month global consumer price inflation had been suggested by recent commodity price trends – third chart. The March decline, however, was larger than expected – a further fall seems unlikely and a rebound is possible, unless commodity prices weaken significantly from current levels.

The estimated March recovery in global real narrow money expansion, therefore, is tentative and requires confirmation from April / May readings before concluding that nine-month-ahead economic prospects are improving. Such confirmation, of course, would not alter the forecast of a further economic slowdown through late 2018.
A firm March reading will be available in early May and will depend importantly on Euroland monetary data to be released on 30 April.
G7 yield curve echoing monetary slowdown signal
The assessment here that the global economy has entered a slowdown phase likely to last through late 2018 (at least) rests primarily on weaker monetary trends since mid-2017. The slope of the G7 yield curve – another longer leading indicator with a respectable historical record – is consistent with the monetary message.
G7 six-month real narrow money growth has displayed a significant positive correlation historically with the slope of the yield curve, defined as a GDP-weighted average of 10-year government yields minus three-month money rates – see chart. The correlation is maximised by applying a two-month lag on real money growth, i.e. money growth appears to move slightly ahead of the yield curve.

While the yield curve slope often gives a similar forecasting message to narrow money trends, the judgement here is that money signals are more reliable.
The yield curve has given some notable false signals historically, e.g. it inverted in 1986 and 1998 but no recession ensued over the following two years. Real narrow money trends did not suggest economic weakness on these occasions.
The yield curve, moreover, can be distorted by central bank efforts to control it through QE and forward guidance. Real narrow money growth picked up strongly between mid-2015 and mid-2016, correctly signalling global economic acceleration in late 2016 / 2017. The yield curve, by contrast, flattened over this period, possibly partly reflecting an increased G7 flow of QE following the start of the ECB’s programme in March 2015. The QE pick-up, indeed, may have both boosted money growth while distorting the yield curve signal.
A further consideration is that real narrow money appears to work better as a forecasting indicator than the yield curve slope in emerging economies. This may partly reflect financial market underdevelopment – the performance of the yield curve may improve as markets deepen and mature. A money-based global forecasting measure, therefore, is likely to outperform one based on interest rates.
Real narrow money trends and the yield curve slope are giving a similar message currently. The monetary slowdown has been accompanied by a flattening curve. Real money continues to grow and the curve has not inverted, so no recession signal has yet been given.


