
Entries from April 1, 2017 - April 30, 2017
Euroland money numbers strong, ECB ignoring "monetary pillar"
 Simon Ward
 Post a Comment
Euroland monetary trends continued to strengthen in March, suggesting solid economic prospects and increasing danger of a 2018-19 inflation overshoot. The ECB’s strategy seems to be to try to delay any meaningful withdrawal of monetary stimulus until after Italian parliamentary elections expected in early 2018 but policy could by then be far “behind the curve”.
Annual growth in the headline M3 broad aggregate rose to 5.3% in March, exceeding a previous high of 5.2% reached in several months in 2015-16. Narrow money M1 growth increased to 9.1%, a 10-month high. The headline measures, however, understate monetary looseness because their growth has been depressed by a fall in money holdings of financial institutions over the past 12 months, probably related to negative rates, which has no adverse implication for economic prospects. The preferred broad and narrow money aggregates here are “non-financial” M3 and M1, comprising holdings of households and non-financial corporations. Annual growth of non-financial M3 rose to 6.1% in March, the fastest since 2008, with non-financial M1 growth at 10.1%, a 17-month high. The continued acceleration of the two aggregates suggests that annual nominal GDP growth will move up towards 4% in late 2017 / 2018 – see first chart.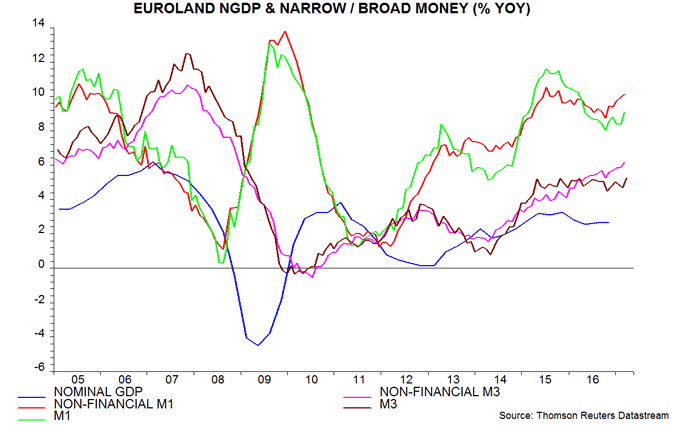
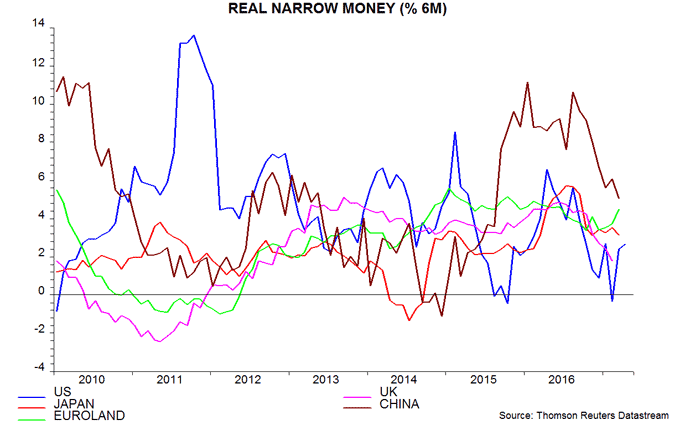
Prospects for economic activity depend on real (i.e. inflation-adjusted) rather than nominal monetary trends. Six-month growth rates of the non-financial money measures deflated by consumer prices (seasonally adjusted) rose strongly in March but are lower than a year ago and roughly in the middle of their ranges over the past three years – second chart. Real money trends, therefore, are consistent with a continuation of GDP growth at its recent pace of 1.5-2% per annum. Relative monetary strength, in other words, suggests that Euroland activity will be insulated from an expected loss of global economic momentum over the summer / autumn – third chart.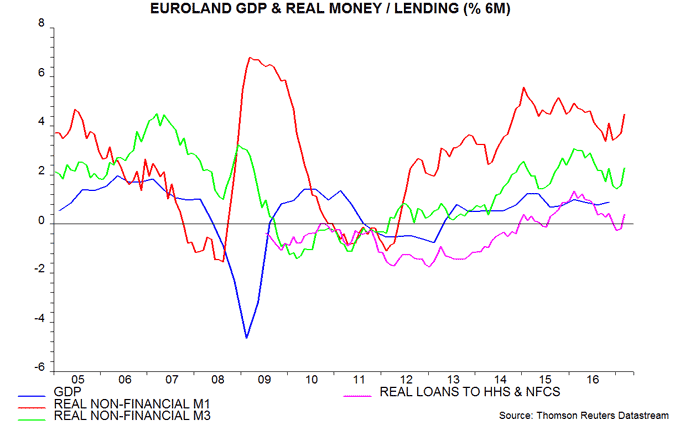
The country breakdown of narrow money (i.e. overnight) deposits shows strong real growth in Portugal, Spain and France, with Germany and Italy lagging – fourth chart. Lacklustre Italian economic prospects may help to explain ECB President Draghi’s determination to hold the hawks at bay until after elections. French monetary strength suggests the potential for a sharp rebound in GDP growth – officially estimated at 0.3% in the first quarter – as political uncertainty abates. A resumption of real money expansion in Greece, meanwhile, may herald improving economic prospects.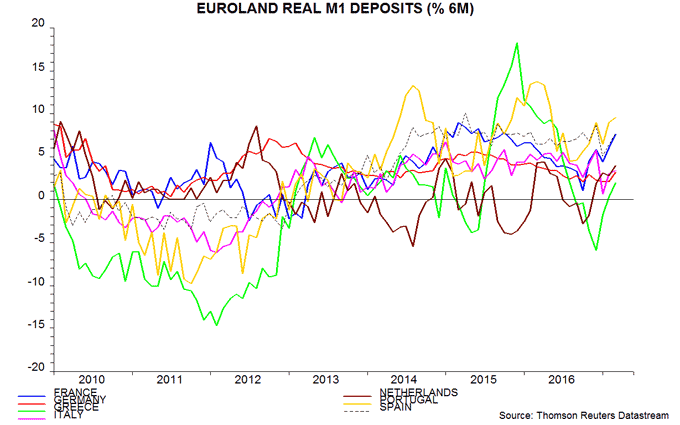
In other Euroland news today, annual “core” consumer price inflation – i.e. excluding energy, food, alcohol and tobacco – jumped from 0.7% in March to 1.2% in April, reflecting Easter timing distortions. Core inflation will probably fall back again in May but the lagged relationship with narrow money growth suggests a rising trend into 2018-19 – fifth chart.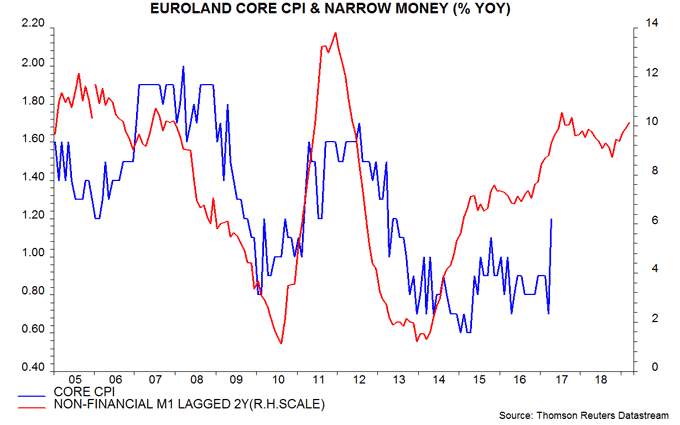
Global growth strong but peaking
Monetary trends in mid to late 2016 suggested that global economic growth would surprise positively in early 2017 but momentum would peak in the spring and slow significantly over the summer (see, for example, here). Recent “soft” economic news (i.e. diffusion indices from business and consumer surveys) has been buoyant, consistent with the forecast, but some “hard” information (i.e. official quantitative data) has lagged – particularly in the US, where GDP may have grown by only 0.5% at an annualised rate in the first quarter, according to the Atlanta Fed. The expectation here is that the weakness in some hard data series will be reversed in the second quarter but that soft news is now peaking and will moderate into mid-year. Both soft and hard data are then likely to weaken through late 2017. Near-term strength in hard data may pose a risk to markets because it will reinforce a shift towards tighter monetary policies at a time when underlying economic momentum is starting to fade.
Most hard data news has, in fact, been solid, if less buoyant than survey evidence. The global industrial output measure tracked here – covering the G7 economies and seven large emerging economies (the “E7”) – is estimated to have risen at a 3.2% annualised pace in the first quarter of 2017. The US has contributed to this performance, with manufacturing output growing by 2.8% annualised, the fastest since 2014.
The long-standing forecast here has been that six-month growth of G7 plus E7 industrial output would peak in the second quarter, possibly in May, and moderate through the third quarter. This reflects a fall in six-month real narrow money growth from a peak in August 2016 – real money growth turning points have led those in output growth by an average of nine months historically. Real money growth reached a low in December 2016 and appears to have rebounded sharply in March, based on partial data – see first chart. This profile, however, partly reflects India’s demonetisation programme, implemented in early November, which resulted in an immediate plunge in narrow money M1 followed by a V-shaped recovery. The third line in the first chart shows an adjusted real money growth series that attempts to iron out this volatility by holding Indian narrow money stable at its October level. This measure reached a low in February, with an estimated small recovery in March. Both the unadjusted and adjusted measures remain significantly below the August 2016 peak. Monetary trends, therefore, continue to signal a weaker economic outlook, with industrial output growth likely to slow through late 2017 (based on the February trough in the adjusted measure).
Confidence here in an imminent reversal of economic momentum has been reinforced by recent OECD leading indicator data (published for February and estimated for March). Six-month growth of a composite G7 plus E7 indicator derived from the OECD country data appears to have peaked in January, with one-month growth falling for a fourth consecutive month in March – second chart. Leading indicator growth turning points have led those in industrial output growth by four to five months on average historically, so this aligns with the monetary forecast that six-month output expansion will top out around May.
The next stage of the scenario should be a fading of business survey strength. The third chart shows a composite G7 plus E7 survey indicator that combines diffusion indices for new orders or output expectations, mostly for the industrial sector. This measure is closely correlated with the widely-monitored Markit global manufacturing purchasing managers’ index (for which a hefty subscription is required for data access) and – like the PMI – has been a coincident to very short leading indicator historically (albeit benefiting from a short publication lag). The indicator may have peaked out in February / March, consistent with a May peak in six-month output expansion.
A softening of business surveys would be expected to be accompanied by a less favourable balance of revisions of company earnings forecasts by equity analysts. The G7 plus E7 business survey indicator correlates closely with the MSCI All Country World Index (ACWI) earnings revisions ratio (seasonally adjusted), which has moderated from a February peak – fourth chart.
The recovery in global six-month real narrow money growth in March suggests that the coming slowdown in economic momentum will bottom out in late 2017 but more evidence is required before adopting this as a central scenario.
The above forecast contrasts with the mood of optimism at the IMF spring meeting of the global policy-making elite and the opinion of the FT’s chief economics commentator, who states that “[t]he world economy is improving” and “[t]here is now a reasonable chance of a cyclical recovery”. The Keynesian consensus, of course, was pessimistic nine months ago as the economy was gaining momentum in line with earlier monetary strength.
UK data suggesting significant Q1 GDP slowdown
The preliminary first-quarter GDP estimate to be released on Friday 28 April may show a quarterly increase of only 0.3-0.4%, while revised data to be issued in late May could upgrade the fourth-quarter rise from 0.7% to 0.8%. The 8 June general election, therefore, may take place against the background of a halving of reported quarterly growth.
A post in early March suggested that GDP would rise by 0.4-0.5% in the first quarter – below a Bank of England staff projection of 0.6% at the time of the March MPC meeting. Subsequent data have, on balance, been weaker than expected then. Services turnover, in particular, was soft in February, suggesting little if any growth in output – see chart. Retail sales volume, meanwhile, fell by 1.8% between February and March, implying a negative impact of 0.1% on monthly GDP. (The sales volume series is used to measure retail distribution output, which has a 5.6% weight in GDP.)
Fourth-quarter GDP growth is currently estimated at 0.7%, with a revision scheduled to be issued on 25 May. A recent upgrade to quarterly services turnover growth suggests that the increase in services output will be revised higher, raising the possibility that GDP growth will move up to 0.8%. (Note that official data already show non-oil GDP growth of 0.8% in the fourth quarter.)
Previous research here suggested that GDP numbers have little impact on voting intentions – the key economic drivers were found to be average earnings growth, the unemployment rate, retail price inflation, house price inflation and Bank rate. A big GDP slowdown, however, would garner media attention and could fuel some voters’ suspicions that Prime Minister May has called an early election in anticipation of Brexit-related economic weakness later in 2017 and in 2018.
Chinese money trends signalling growth moderation not weakness
Chinese monetary trends signalled current economic strength and now suggest a modest loss of momentum during the second half of 2017.
First-quarter and March economic data released yesterday were mostly stronger than expected. Annual growth of nominal GDP rose to 11.8% last quarter, the fastest since 2012 and up from a low of 6.4% at end-2015. The recent surge has been driven by the GDP deflator but real GDP growth of 6.9% was above the consensus forecast and a 6.5% full-year official target – see first chart. Annual industrial output expansion, meanwhile, climbed to 7.6% in March, the fastest since 2014, despite a slowdown in auto manufacturing following a partial reversal of the 2015 sales tax cut on smaller vehicles.

These robust results are consistent with monetary strength last summer. The preferred narrow and broad monetary aggregates here are “true” M1 and M2 excluding financial corporations' deposits respectively. True M1 includes household demand / temporary deposits, which are relevant for assessing consumer spending prospects. (The official M1 measure includes only corporate deposits.) Financial deposits within M2, meanwhile, have been highly volatile in recent years but appear uncorrelated with economic developments.
Annual growth of the two preferred measures rose significantly between mid-2015 and summer 2016, signalling that nominal GDP expansion would pick up strongly into the first half of 2017 – second chart. True M1 growth peaked in August 2016, at 22.1%, and growth of M2 ex. financial deposits in November, at 13.4%. The latest figures, for March, are 16.3% and 11.4% respectively. The lag between money growth and nominal GDP growth turning points has been variable in recent years but a reasonable expectation is that annual nominal GDP expansion is at or close to a peak and will moderate during the second half of 2017.

The two money growth measures have retraced less than one-third of their rise over 2015-16, suggesting a minor decline in nominal GDP expansion, which should remain well above the low reached in late 2015.
Economic activity prospects are related to real (i.e. inflation-adjusted) rather than nominal monetary trends. The third chart shows six-month rates of change of industrial output and narrow / broad money deflated by consumer prices (seasonally adjusted). The real money growth measures have fallen significantly since summer / autumn 2016 but are close to their averages since 2010, consistent with a moderation in economic expansion rather than a return to sub-par performance. The typical nine-month lead suggests that coincident economic news will remain robust into mid-2017.

UK inflation: Easter effect obscures strong upswing
UK annual consumer price (CPI) inflation was stable at 2.3% in March but remains on course to move above 3% in the second half of 2017, implying a significant overshoot of the Monetary Policy Committee’s central forecast (showing inflation of 2.6% and 2.7% in the third and fourth quarters respectively).
CPI inflation was suppressed by a 23% year-on-year fall in air fares due the later timing of the Easter holiday this year compared with 2016. This effect subtracted 0.2 percentage points from the headline rate but will reverse in April.
The forecast of a move above 3% is based on “core” inflation – defined here as the annual CPI increase excluding energy, food, alcohol, tobacco and education, and adjusted for VAT changes – rising to about 2.5% by late 2017 and the headline / core gap climbing to more than 1 percentage point. The air fares effect resulted in the core rate retreating from 1.9% in February to 1.7% in March – see first chart. Seasonally-adjusted core prices, however, rose at a 2.5% annualised rate in latest three months from the prior three, consistent with the forecast – second chart.

The headline / core gap, meanwhile, increased to 0.6 percentage points in March, the highest since 2013, and the lagged relationship with sterling commodity prices suggests that it will peak well above 1 percentage point later in 2017 and remain elevated into 2018, unless commodity prices weaken or the exchange rate rallies significantly – third chart.
A post last month argued that inflation is rising in lagged response to a significant increase in monetary expansion between 2011 and late 2016. The fall in the exchange rate has been part of the “transmission mechanism” from loose money to faster price rises, rather than being a primary driver. The historical evidence is that money growth peaks lead core inflation peaks by between two and three years. Assuming that annual broad money growth topped out last autumn*, the suggestion is that inflation will remain under upward pressure through late 2018, at least.
*Annual growth of non-financial M4 peaked at 6.8% in September 2016, falling to 5.4% in February 2017 – see previous post.
A "monetarist" perspective on current equity markets
Global economic growth remained robust in early 2017 but monetary trends and leading indicators suggest that strength will fade from the spring. Central banks may continue to withdraw policy stimulus despite slower economic momentum because of late-cycle inflationary pressures. Lower real money growth implies a less favourable liquidity backdrop for markets, while earnings may fall short of expectations as the global economy cools.
On our calculations, GDP in the G7 major economies and seven large emerging economies (the “E7”) rose at a 2.8% annualised pace in the fourth quarter of 2016 after a 3.2% third-quarter gain. Average growth of 3.0% over the second half was the fastest since the second half of 2014. Business surveys signal continued strength in early 2017: J P Morgan’s global all-industry purchasing managers’ output index rose further between the fourth and first quarters.
Global economic acceleration was predicted by monetary trends. Our key global forecasting indicator is the six-month growth rate of real (i.e. inflation-adjusted) narrow money in the G7 plus E7 economies. Narrow money comprises currency in circulation and demand deposits – forms of money most closely related to economic transactions. Turning points in this indicator have consistently led turning points in G7 plus E7 industrial output growth over the past 50+ years, typically by between six and 12 months.
Real narrow money growth peaked in August 2016 at its fastest pace since 2009, suggesting that economic momentum would rise into spring 2017, allowing for an average nine-month lead. The subsequent monetary slowdown was exaggerated by India’s “demonetisation” programme, which resulted in narrow money M1 plunging by 30% between October and December. We have attempted to adjust for this distortion by recalculating our real money growth measure holding Indian M1 stable at its pre-demonetisation level. The adjusted measure fell sharply in late 2016 / early 2017, reaching an 18-month low in February – see first chart. Four-fifths of the decline in the measure since August 2016 has reflected weaker nominal narrow money expansion, with the remaining one-fifth due to higher inflation.
Our forecasting process seeks confirmation of monetary signals from a non-monetary composite leading indicator for the G7 plus E7 economies, derived from OECD country leading indicator data. This indicator combines a wide range of economic and financial series that have led activity fluctuations historically. Its average lead time at turning points is shorter than for real narrow money – typically four to five months. Six-month growth of the indicator plateaued in February, while one-month growth fell for a second month – second chart. This behaviour is consistent with the suggested scenario of global economic momentum slowing from a spring peak.
Real narrow money growth has fallen by varying amounts across the major economies. Weakness has been most pronounced in the US, suggesting that GDP expansion will fall short of Federal Reserve and consensus expectations – third chart. The UK has also slowed sharply recently. Growth, by contrast, is holding up in Euroland and Japan, and remains high in China. Brazil and Russia are bucking the trend, with real money growth reviving as inflation falls and policy eases.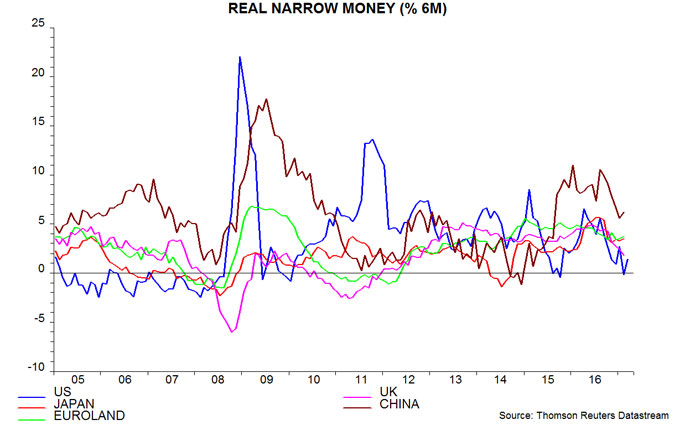
With monetary trends giving mixed signals across countries, our base-case scenario is for a moderate global economic slowdown rather than significant weakness. This would be consistent with our economic cycle analysis, which suggests that the US / global stockbuilding and business investment cycles will remain in upswings through 2017. Such a scenario, however, requires our global adjusted real narrow money growth measure to stabilise or recover from its current position near the bottom of its post-crisis range – first chart.
Early- or mid-cycle economic slowdowns usually generate a swift central bank response and are associated with falling government bond yields and commodity price weakness. Late-cycle slowdowns, by contrast, are often accompanied by a rise in inflation due to tight labour markets, capacity constraints and productivity slippage, delaying policy relief and yield declines. The G7 unemployment rate is lower than at the peaks of the last two economic cycles – fourth chart. Upward pressure on wage growth and core inflation may keep central banks on a tightening tack despite softer economic data, with negative implications for equities.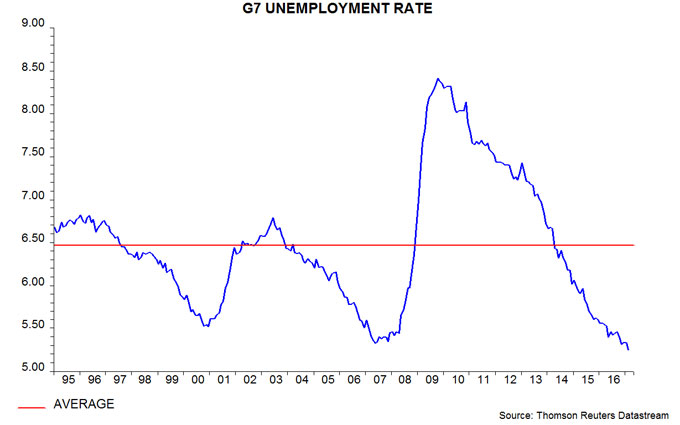
Our analysis of data since 1970 indicates that major equity market declines have usually been preceded by one or more of the following conditions: 1) G7 annual real narrow money growth falling below 3%; 2) real money growth falling below industrial output expansion; 3) real money growth falling by 3 percentage points or more within six months. Conditions 1) and 2) are unlikely to be triggered soon but real money growth has declined from a peak of 8.6% in October 2016 to 6.5% in February; a further fall to 5.5% or lower by April, therefore, would meet condition 3) and warrant shifting to a defensive investment stance.
Relative real narrow money trends argue for overweighting emerging versus developed markets, and EAFE markets versus the US. E7 real money growth, adjusted for India’s demonetisation, remains above the G7 level, a condition associated with emerging markets outperforming on average historically – fifth chart. A sustained shortfall of US real money growth relative to other developed economies, meanwhile, would be reminiscent of the mid 2000s, when EAFE stocks outpaced the US market, partly reflecting a weakening US dollar.
Our previous quarterly commentary questioned consensus bullishness on the dollar on the grounds that a record capital outflow from Euroland, Japan and China had boosted the US currency in 2016 but was likely to slow in 2017. Recent data are consistent with this hypothesis and the reversal in capital flows may extend if US economic growth weakens relative to the rest of the world, as suggested by monetary trends. A recovery in the renminbi is possible in response to a rise in Chinese / US interest rate differentials in the first quarter and as Chinese policy shifts towards promoting a firmer exchange rate to defuse trade tensions with the US administration.
