
Entries from April 1, 2016 - April 30, 2016
Japanese narrow money growth firmer, broad stable
 Simon Ward
 Post a Comment
Japanese monetary trends suggest that the economy will recover from recent stagnation.
Narrow money M1 rose by 1.8% in February / March combined, representing the largest two-month gain since March / April 2011, following the Tohoku earthquake and tsunami. Six-month growth of real (i.e. inflation-adjusted) M1 in March was the highest since September – see first chart.
The pick-up reflects the Bank of Japan’s 29 January decision to cut the marginal interest rate on bank reserves to -0.1%. The 1.8% increase in M1 in February / March is identical to an increase in Eurozone M1 in July / August 2014 after the ECB cut its overnight deposit rate to -0.1% in June. Eurozone M1 acceleration was sustained and was followed by stronger economic growth from late 2014 (when the IMF was warning of a 40% risk of a recession).
Japanese six-month real narrow money growth is currently still at the low end of the range across major economies, suggesting better economic prospects elsewhere – second chart. 
Broad money M3 has yet to confirm the more positive signal from M1, growing by 0.2% per month in February and March, in line with the average over the prior 12 months. Six-month growth of real M3 eased further in March – first chart.
M3 has been comically impervious to the BoJ’s QE blitz. Annual growth of 2.6% in March was identical to the rate in April 2013 when incoming Governor Kuroda fired his “quantitative and qualitative easing” (QQE) bazooka. In monetary terms, his missile was defused by a combination of commercial bank sales of JGBs, a balance-of-payments outflow and lack of private sector credit demand.
The third chart below shows that a rise in the contribution to annual broad money growth since early 2013 of expanding BoJ credit to the government has been outweighed by a faster contraction of commercial bank lending. Posts in 2013 (e.g. here) argued against claims that QE would boost broad money growth significantly but the scepticism did not extend to expecting zero impact.
QQE did contribute to a massive undershoot of the yen. Economic pessimists argue that the currency’s rebound will deliver a further blow to a struggling economy. The rise to date, however, has reversed less than a third of the fall in the effective rate since 2012, while a recovery in global trade during 2016 may outweigh any negative competitiveness effect on export performance.
US forecasting indicators less negative
The Atlanta Federal Reserve estimates that US GDP growth fell to 0.1% annualised in the first quarter, reflecting drags from (in order of magnitude) reduced inventory accumulation, a wider trade deficit and lower business investment. This would imply growth in the fourth and first quarters combined of only 0.7%, or 0.35% before annualisation.
The weakness of the economy in the last two quarters was predicted by a sharp fall in six-month growth of real (i.e. inflation-adjusted) narrow money between February and October 2015, i.e. points 8 and 9 in the first chart below. As the chart shows, turning points in six-month real money growth have consistently preceded those in two-quarter GDP expansion in recent years, usually by between six and 12 months.
Real narrow money growth has revived since October 2015, suggesting that that a recovery in GDP expansion will begin between April and October 2016. Labour market data, however, may soften near term in lagged response to GDP weakness. The employment indices of the Institute for Supply Management purchasing managers’ surveys are consistent with this scenario – second chart.


The forecast that GDP momentum is at or close to a low is supported by the OECD’s US composite leading indicator. The OECD presents its leading indicators in “ratio to trend” format, i.e. a rise (fall) indicates that the economy is growing above (below) trend. The US indicator continued to decline in February but at a slower pace, consistent with below-trend but rising GDP growth.
An alternative approach, preferred here, is to monitor the rate of change of the indicator before detrending. The one- and six-month changes are clearly signalling an approaching upturn in economic momentum – third chart
The indicator’s components are: housing starts, consumer sentiment, average weekly hours, durable orders, the ISM manufacturing purchasing managers’ index (PMI), the yield curve and stock prices. The PMI, stocks and weekly hours contributed to the recent recovery.
Neither monetary trends nor the leading indicator yet suggest a strong economic pick-up. There is a risk that real money growth will fall back as higher energy prices lift inflation.
The recovery in the US indicator follows a pick-up in its Chinese counterpart – fourth chart. The twin improvement is consistent with the central scenario here of a recovery in global economic growth during 2016 – see Friday's post.

A "monetarist" perspective on current equity markets
Global economic growth was depressed over the past 18 months by the disruptive effects of the crash in oil prices and successive slowdowns in China and the US. These drags are fading, while global money and credit trends remain solid. The combination of recovering economic activity with plentiful liquidity argues for a positive bias towards equity markets but there are risks stemming from poor productivity performance, an associated rise in “core” inflation and possible further policy missteps.
Economists expected the 2014-15 oil price collapse to boost global growth as increased disposable income and spending of energy consumers offset cut-backs by producers. This neglected the scale of overinvestment in energy extraction during the period of high prices and the consequent potential for a capex bust. US consumers, meanwhile, saved much of the windfall from lower energy bills, perhaps reflecting lingering post-crisis caution and an expectation of higher interest rates.
Energy capex cuts are probably nearing an end, while the US personal saving ratio may be at or close to a peak. The oil market is returning to balance, suggesting a stabilisation or recovery of prices. Following a sharp increase in 2014-15 that triggered the price collapse, global oil supply growth is slowing and may soon converge with rising demand expansion – see first chart.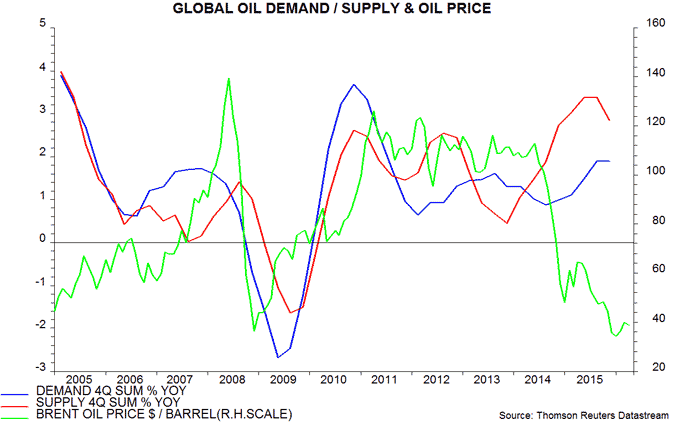
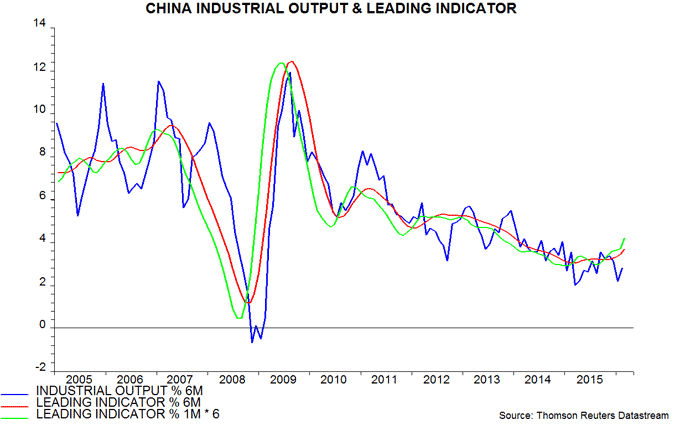
China’s economic slowdown was a major drag on global growth in 2015. It had been predicted by monetary trends: the six-month rate of change of real (i.e. inflation-adjusted) narrow* money, as measured by “true” M1, turned negative at the end of 2014 – second chart. Following policy easing during the first half of 2015, however, real money growth rebounded strongly, suggesting an economic recovery in 2016. This appears to be playing out, with the housing market strengthening, profits recovering and business confidence rising.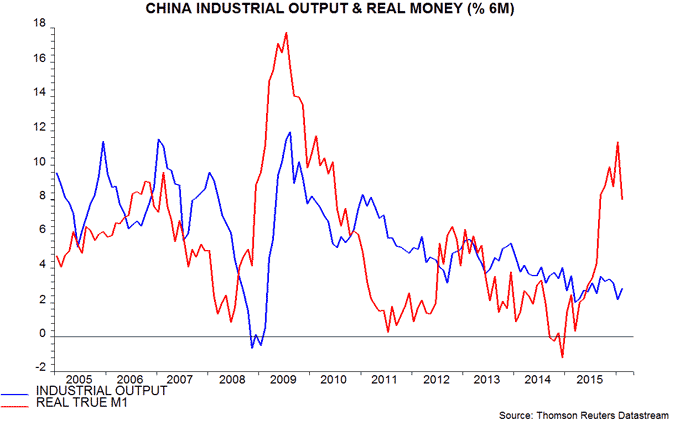
The Chinese slowdown was followed by a loss of US economic momentum in late 2015 and early 2016. This had also been foreshadowed by monetary trends, with real narrow money slowing sharply between February and October 2015 – third chart. Real money growth remains modest but has recovered in early 2016, consistent with the economy regaining some momentum during the second half.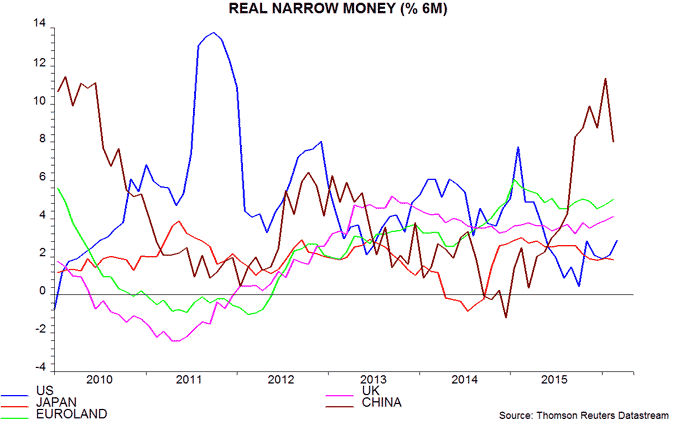
The US economic slowdown has pushed back interest rate rises, relieved upward pressure on the US dollar and contributed to a rally in commodity prices – in line with the central scenario proposed in our previous commentary. Worries about higher US interest rates may remain in abeyance during the second quarter as recent low GDP growth feeds through to softer labour market data. Recovering monetary expansion suggests that upward pressure on rates will return later in 2016, however.
European economic growth has been stable and respectable, questioning downbeat commentary on the region. Eurozone GDP rose by 1.6% in the year to the fourth quarter of 2015, with domestic demand up by 2.2% – the fastest annual growth since 2007. This performance should be assessed against “potential” economic expansion estimated by the EU Commission, IMF and OECD at only 1.0-1.2%. Above-potential growth has been reflected in a steady decline in unemployment.
UK economic solidity has also received insufficient recognition. GDP growth in the fourth quarter was the highest in the G7 and the indications for the first quarter are positive. Real narrow money growth in the Eurozone and UK remains stable and stronger than in the US and Japan, suggesting upside risk to consensus GDP forecasts.
Our “global” real money and bank lending growth measures, covering the G7 developed economies and seven large emerging economies (the “E7”), have remained range-bound at historically-respectable rates – fourth chart. Real money growth continues to run well above economic expansion, a condition normally associated with rising asset prices. The resilience, in aggregate, of equity, bond and property markets despite recent economic difficulties is consistent with a supportive liquidity backdrop.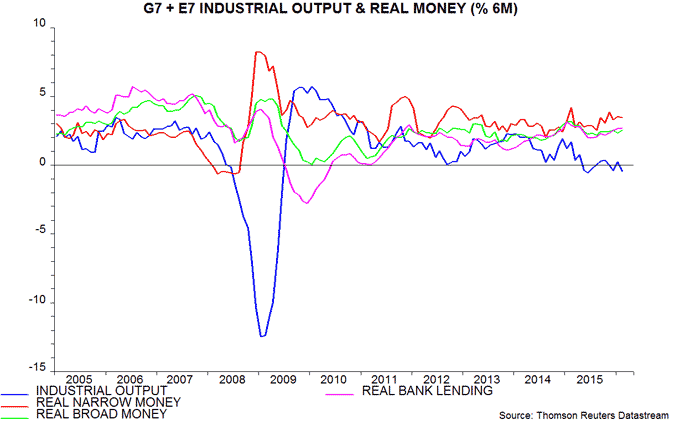
The recovery in equity markets later in the first quarter may partly discount a near-term firming of global economic growth and an extension of the US interest rate pause. The combination, however, of plentiful liquidity with positive economic news from China / Europe and a cooler US labour market over the spring / summer may allow the rally to extend.
The assessment here is cautiously rather than fully optimistic, for several reasons. First, global productivity trends remain dismal. Productivity stagnation has supported growth of employment and consumer spending but at the expense of rising unit labour costs and a squeeze on profit margins. Labour markets, moreover, may now have tightened sufficiently to trigger an acceleration of wages.
Secondly, and relatedly, G7 “core” inflation is firming, threatening a sharp rise in headline rates later in 2016 as favourable energy and food price effects unwind. The annual increase in G7 consumer prices excluding food and energy was 1.6% in February, a four-year high – fifth chart. An inflation snap-back could raise concerns that G7 monetary policies are excessively loose, leading to a disruptive rise in bond yields.
Rising inflation, it should be emphasised, is an issue for developed rather than emerging economies. E7 core pressures are moderating in response to weak activity and currency stabilisation, opening the door to monetary policy easing – sixth chart. 
A third concern is that ECB and Bank of Japan experimentation with negative interest rates will have a net contractionary impact, for example by damaging banks’ profitability and capacity to expand or prompting households to save more to achieve asset growth targets. Monetary trends have weakened in Denmark and Switzerland, where rates first became significantly negative. As noted, Eurozone narrow money growth is strong but the numbers have yet to reflect the full impact of December / March rate cuts.
Current real narrow money trends argue for a bias to overweight the Eurozone and the UK while underweighting Japan and the US in a developed markets equity portfolio – second chart. UK relative equity market performance has been depressed by a rise in the risk premium on sterling assets due to the forthcoming June “Brexit” referendum on the country’s EU membership. A rebound is likely in the event of a “remain” decision; “exit” would trigger wider market turbulence, probably involving generalised European underperformance.
In other developed markets, real narrow money is growing respectably in Canada and Sweden but has slowed sharply in Australia and is contracting in Switzerland, suggesting underweighting Swiss equities.
The outperformance of emerging equity markets during the first quarter followed a cross-over of six-month real narrow money growth in the E7 above the G7 level in late 2015 – seventh chart; as noted in the previous commentary, the sign of the E7 / G7 gap has had a positive association with the sign of emerging market relative returns historically. The real money growth gap remains favourable for emerging equities, while a Chinese economic recovery, lower E7 core inflation and a delayed rise in US interest rates may also be supportive.
*Narrow money = currency in circulation plus demand deposits and close substitutes. Broad money = narrow money plus time deposits, notice accounts, repos and bank securities. Precise definitions vary by country. Narrow money has been more reliable than broad money for forecasting purposes historically and is consequently emphasised in the analysis here.
Trade / real rates supporting stronger yen
According to a senior Financial Times commentator, “The sharp appreciation of the yen against the dollar, despite negative policy interest rates, reversed the normal currency market laws of gravity.” Did it?
Historically, trend moves in the dollar-yen exchange rate have usually followed changes in the differential between the US and Japanese trade balances, expressed as percentages of their respective GDPs. That is, the yen has tended to strengthen after the Japanese trade balance has improved relative to the US position. The trade balance gap has indeed moved in the yen’s favour since 2014: the Japanese position has swung from a large deficit to a small surplus, while the US deficit has been broadly stable – see first chart. 
What about the supposed boost to the dollar from a widening US-Japan policy interest rate gap? The wider nominal gap has been more than offset by a rise in US headline consumer price inflation relative to the Japanese level. The “real” policy rate gap, therefore, has moved in favour of the yen since 2014, reinforcing support from relative trade developments – second chart.
The US-Japanese inflation differential is likely to increase further as unwinding energy effects give a larger boost to the US headline rate and the stronger yen suppresses Japanese pressures.
The yen’s rebound, therefore, is consistent with historical “laws of gravity”, contrary to the FT writer’s assertion.

US labour market starting to cool
US non-farm payrolls rose by a solid 215,000, or 0.15%, in March but gains seem likely to slow in the second quarter, supporting Fed Chair Yellen’s caution about raising rates.
Recent divergence of GDP and employment trends is unsustainable. GDP growth is on course to average about 1% annualised in the fourth and first quarters combined, based on the latest official fourth-quarter estimate of 1.4% and the Atlanta Fed’s “nowcast” of 0.7% expansion in the first quarter. Payrolls, meanwhile, rose by 2.1% annualised in the six months to March.
Faster growth of jobs than output implies upward pressure on unit labour costs and downward pressure on profits. It is unsustainable because lower profits cause firms to reduce hiring and increase lay-offs.
While payrolls rose respectably in March, other features of the labour market report suggest cooling. Average weekly hours failed to recover from a fall in February and are down on a year ago. Temporary help jobs usually lead aggregate payrolls and were stagnant in March after sizeable falls in January and February – see first chart.
The notion that firms are scaling back hiring is also supported by a recent decline in the Conference Board’s online help-wanted indices – second chart.
Will a weaker labour market feed back into even slower GDP growth, or even a recession? Monetary trends are giving a reassuring message. Six-month growth of real narrow money fell sharply into October 2015, warning of recent economic softness, but recovered at year-end and appears to have risen to a 10-month high in March, based on available weekly data – third chart. The suggestion is that GDP momentum will revive from around mid-year, in which case any near-term labour market weakening is likely to prove temporary.
Chinese economic news improving, money signal still positive
Chinese economic growth is reviving, as predicted by stronger monetary expansion last autumn (see, for example, here). The latest monetary data suggest that the recovery will extend through late summer, at least.
March purchasing managers’ survey results beat consensus estimates, with forward-looking components notably stronger. The new orders indices in the official and Markit / Caixin manufacturing surveys rose above 50, to their highest levels since September 2014 and February 2015 respectively – see first chart. A pick-up had been suggested by a sharp rise in the business expectations component of the official survey in February; this component strengthened further in March – second chart.

The new orders component of the official non-manufacturing survey also regained the 50 level last month, having fallen below it in January / February.
Not all business surveys are yet giving a positive message. The PBoC’s quarterly survey of entrepreneurs, also released today, reported a further weakening of domestic and export orders. This survey, however, seems to lag at turning points: for example, the official and Markit / Caixin manufacturing PMI new orders indices bottomed in November 2008 but the trough in the PBoC survey orders components occurred in the first quarter of 2009.
Other recent indicators support the view that reflation is underway. Annual new house price inflation rose further to 3.6% in February, while industrial profits in January / February were up by 4.8% from a year before. The improvement in these series is consistent with the normal pattern following money supply acceleration – third chart.
Foreign exchange reserves data for March next week could provide further good news, showing a slowdown in the rate of decline or even a small rise. The monthly reserves change has been positively correlated with the premium / discount of the offshore renminbi (CNH) to the onshore rate (CNY); a premium has recently been restored, following a large discount in January – fourth chart. Valuation effects should boost the US dollar value of reserves, with the US currency weakening against the euro, sterling and yen during March.
The PBoC has taken advantage of dollar weakness to pursue further depreciation against the new currency basket. The RMB index is down by 2.9% since the start of the year and 7.2% below its level before the August mini-devaluation – fifth chart. This has contributed to a recovery in the PMI export order indices, although global activity, in addition, may be firming.
