Entries from April 1, 2012 - April 30, 2012
Glimmers of hope in latest Eurozone money numbers
Eurozone monetary trends are improving at the margin, suggesting that the ECB’s rate cuts and liquidity injections have been at least partially effective and consistent with a stabilisation of EMU-wide output by the late summer. A recovery, moreover, has occurred in the periphery as well as the core in the last two months, a development that – if sustained – could herald an end to recessions in the former group by late 2012.
The key monetary forecasting indicator employed here is the six-month change in real narrow money M1, which outperforms the broader M3 measure. This turned heavily negative in early 2011, warning of the current recession. It recovered to -0.1% (not annualised) in March, consistent with industrial output stabilising from around September, allowing for the usual six-month lead – see first chart.
M1 comprises currency in circulation and overnight deposits. The ECB publishes a country breakdown of deposits but not currency. In the six months to March, real M1 deposits rose by 2.8% (not annualised) in the “core” (i.e. Germany, France, Benelux, Austria) but fell by 3.7% in the “periphery” (Italy, Spain, Greece, Portugal, Ireland). The peripheral decline, however, eased from 5.6% in February – second chart.
The six-month changes continue to be dominated by monetary weakness in late 2011 / January 2012. EMU-wide real M1 deposits rose by a solid 1.0% in February and March combined, with similar increases in the core and periphery – third chart.
It is still early days but a further recovery in peripheral real M1 would suggest an end to recessions by late 2012. The risk, however, is that the lagged impact of the ECB’s rate cuts and liquidity injections will be offset by the recent renewed rise in financial tensions, reflected in wider peripheral / core spreads. Further ECB rate cuts are warranted to reduce this risk.


Global bank reserves still climbing
Central bank policies continue to provide support for risk assets, with the Bank of Japan today announcing a further ¥10 trillion expansion to ¥40 trillion in planned securities purchases, implying buying of ¥25 trillion – $310 billion – between now and mid-2013 (since the portfolio currently stands at ¥15 trillion).
The link between asset purchases and bank reserves (i.e. cash held by banks at the central bank) is looser in Japan than in the US and UK but it would be surprising if this buying failed to result in a further substantial injection of liquidity – reserves have risen by ¥8 trillion since the announcement on 14 February of an expansion in securities purchases from ¥20 trillion to ¥30 trillion.
Aggregate bank reserves in the US, Japan, Euroland and the UK recently reached a new record, a development that may help to explain the resilience of global equities to another rise in European financial tensions and moderately disappointing economic news. The increase since mid-2011, however, has been concentrated in Europe, with US reserves static.
UK GDP highlights dismal supply-side performance
The claim by the Office for National Statistics that GDP fell by 0.2% in the first quarter following a 0.3% fourth-quarter decline deepens the “productivity puzzle” – the apparent contradiction between output and labour market data.
A previous post warned that construction would act as a significant drag on first-quarter GDP but the surprise in today’s release was the weakness of the rest of the economy – GDP ex. construction was flat.
Total hours worked in the economy, however, rose by 1.4% in the three months to February from the prior three months. Official statistics, in other words, are inconsistent, suggesting that output has fallen despite a rise in labour input.
On a year-over-year basis, GDP was unchanged in the first quarter while hours worked fell by 0.1% in the three months to February. Productivity, seemingly, rose by only 0.1%. In its last Economic and fiscal outlook, the Office for Budget Responsibility forecast that “potential” productivity would increase by 0.6% in 2012. Growth was projected to pick up to 2.2% by 2015 – in line with the pre-crisis trend.
The “puzzle” may be lessened by future upward revisions to GDP but these are unlikely to be large enough to reverse the conclusion of dismal supply-side performance, carrying negative implications for inflation and fiscal prospects.
The GDP decline will dominate the headlines but the April quarterly CBI industrial trends survey also released today is arguably more significant, suggesting an improved economic outlook – seasonally-adjusted business optimism rose to its highest level for two years. Employment expectations were particularly strong but skill shortages jumped – further evidence of supply-side weakness.

Better ECB bank lending survey offsets negative PMI surprise
Eurozone “flash” PMI results for April released on Monday were much weaker than expected here – a solid German Ifo business survey last week together with stable analyst expectations for company earnings and less negative leading indicators had suggested improvement.
It is, however, possible that the PMIs have yet to reflect easier monetary conditions resulting from the ECB’s interest rate cuts and liquidity injections. This view is supported by today’s ECB bank lending survey, showing sharp declines in the net percentages of banks tightening or planning to tighten credit standards on loans to enterprises. The tightening percentages lead (inversely) industrial activity, suggesting a stabilisation or recovery in output into the summer – see chart.
The case for optimism would be increased by a solid March increase in Eurozone M1 in money supply numbers to be reported on Monday.
Has ECB policy easing failed?
The forecast here that the global economy will retain momentum through mid-year is supported by yesterday’s US Philadelphia Fed manufacturing survey for April and today’s German Ifo poll. The expected new orders balance in the Philadelphia survey – which often leads the national ISM orders reading – remains above average.
German manufacturing expectations, meanwhile, continued to recover in April, reaching a nine-month high. The historical correlation with the Eurozone purchasing managers’ new orders index suggests that the “flash” April PMI survey released on Monday will surprise positively.
The consensus view is that the German pick-up is not representative of the wider Eurozone and will reverse as peripheral recessions deepen. Other indicators, however, are also hinting at an improvement in the Eurozone PMI survey, including equity analysts’ earnings revisions and a leading indicator derived from OECD data.

Renewed weakness in peripheral sovereign bond markets has encouraged claims that the ECB’s interest rate cuts and liquidity injections have been ineffective. The view here is that such a judgement is premature: monetary policy acts with a lag and the latest money supply statistics – for February – do not incorporate even the initial impact of the second, larger three-year LTRO. Eurozone-wide M1 recovered modestly in the latest three months.

UK house prices now undervalued relative to rents
Reader's question: Have you repeated your national-accounts analysis of residential property yields recently? I'm referring to the long-term yield analysis you most recently did here (I think). Just wondering if this has changed at all over the past year. My guess is not (or possibly it's slightly higher). Do you have any thoughts?
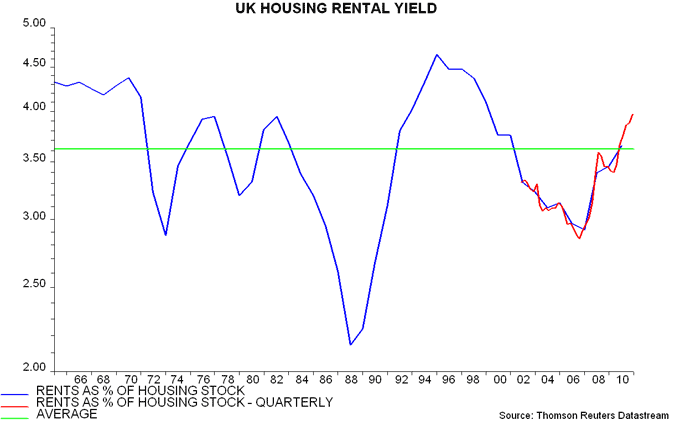
The national accounts rental yield ended 2011 at an estimated 3.97% versus a long-run average of 3.62%, suggesting that house prices are undervalued by about 9% relative to rents – see first chart. The 2011 number is an estimate because ONS has yet to publish an end-2011 figure for the value of the housing stock.
A rise from 3.65% at the end of 2010 reflected an increase of 8.8% in actual and imputed rents last year (i.e. comparing calendars 2011 and 2010), with house prices flat (up by 0.1% between December 2010 and December 2011 according to the DCLG house price index, which is used to revalue the housing stock).
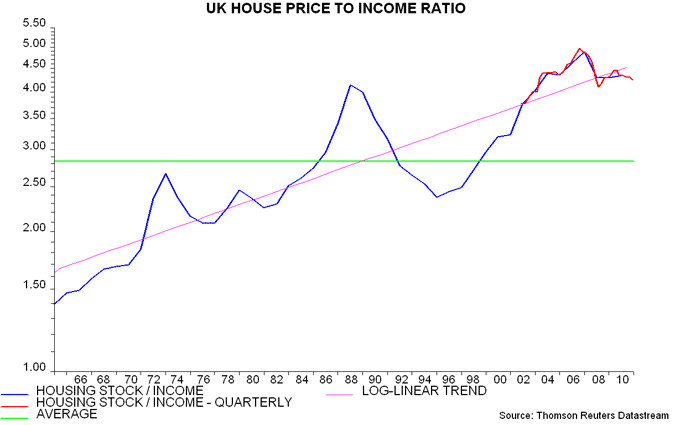
The housing stock to disposable income ratio remains far above its long-term average but is now 6% below its rising trend – second chart. This trend, of course, reflects the same supply / demand factors that have pushed up rents relative to income over the long run.


