UK monetary trends have been signalling an economic slowdown in the second half of 2017. Today’s downward revision to quarterly GDP growth in the first quarter to only 0.2% raises the question of whether the slowdown has already arrived. The assessment here is that first-quarter weakness partly represented payback for solid performance during the second half of 2016 and quarterly growth is likely to bounce back in the second quarter before fading later in the year.
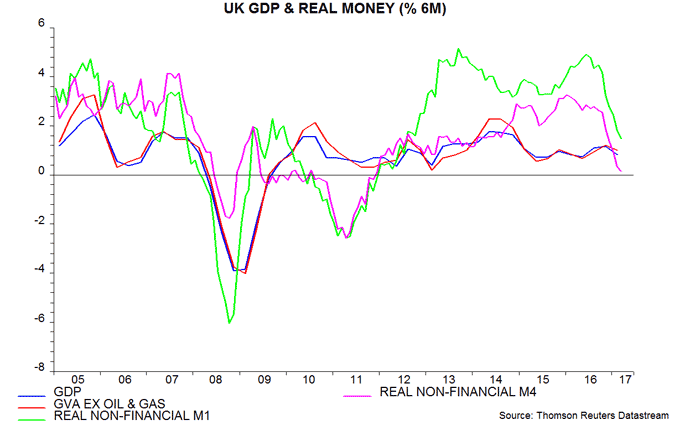
The analytical approach here focuses on six-month or two-quarter changes to assess trends in economic series, on the basis that this reduces noise while still allowing timely identification of turning points. GDP rose by 0.85%, or 1.7% at an annualised rate, in the fourth and first quarters combined. Excluding oil and gas extraction, output grew by an annualised 1.9% – equal to or above estimates of potential economic expansion*.
This respectable performance was signalled by monetary trends in the first half of 2016. Six-month growth of real narrow money – as measured by non-financial M1 deflated by consumer prices – peaked in June 2016 and remained elevated through October. Allowing for a typical nine-month lead, this suggested that economic growth would hold up through summer 2017. Real money, however, slowed sharply in late 2016 / early 2017, warning of economic weakness in late 2017 – see first chart.
The monetary forecast, therefore, implies a bounce-back in quarterly growth in the second quarter. The expenditure breakdown for the first quarter is consistent with this expectation. Domestic demand – adjusted to exclude the net acquisition of gold and other valuables – rose by 0.8% on the quarter, with a slowdown in household consumption expansion (from 0.7% to 0.3%) offset by faster growth of government consumption (0.8%) and fixed investment (1.2%). GDP expansion was depressed by a fall in net exports, which may rebound in the current quarter, partly reflecting solid global demand.
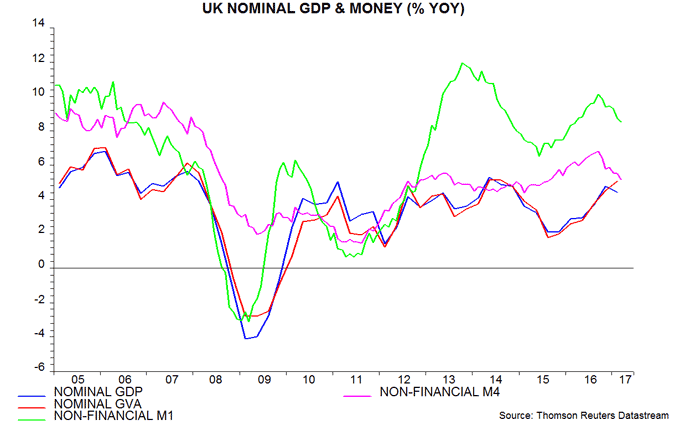
Nominal aggregates, meanwhile, continue to rise strongly, as earlier monetary strength feeds through to higher inflation. Annual growth of nominal GDP moderated to 4.4% in the first quarter but annual growth of nominal gross value added** (GVA) rose to 5.1%, the fastest since 2014 – second chart. Assuming potential economic expansion of no more than 2% per annum, nominal GDP / GVA growth needs to be limited to about 4% to be consistent with the 2% inflation target. Money trends suggest that growth is at or close to a peak.
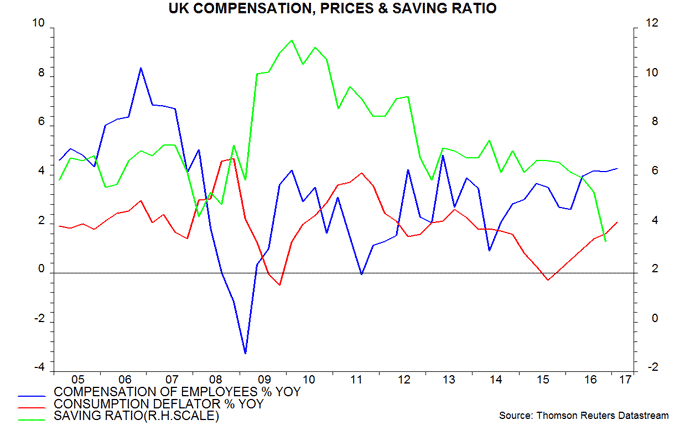
The inflation drag on consumer spending has been moderated by faster expansion of aggregate employee incomes, reflecting modestly higher average earnings growth and resilient employment trends. Annual growth of employee compensation rose to 4.3% in the first quarter, the most since 2013 and compared with a 2.1% annual increase in the price deflator for household consumption. Real compensation, by contrast, contracted during the last inflation upsurge in 2010-11; consumer spending, however, was cushioned by a fall in the saving ratio from a high post-recession level – third chart.
*2017 potential growth estimates: OBR 1.9%, IMF 1.8%, EU Commission 1.6%, OECD 1.5%.
**GVA excludes indirect taxes and subsidies.