UK GDP and monetary data released today support the upbeat view here of current and prospective economic performance – see previous post.
GDP is now estimated to have risen by 0.6% between the third and fourth quarters of 2015, up from 0.5% previously. The upgrade was due to the services sector, where output increased by a bumper 0.8% – the strongest quarterly gain since the fourth quarter of 2015.
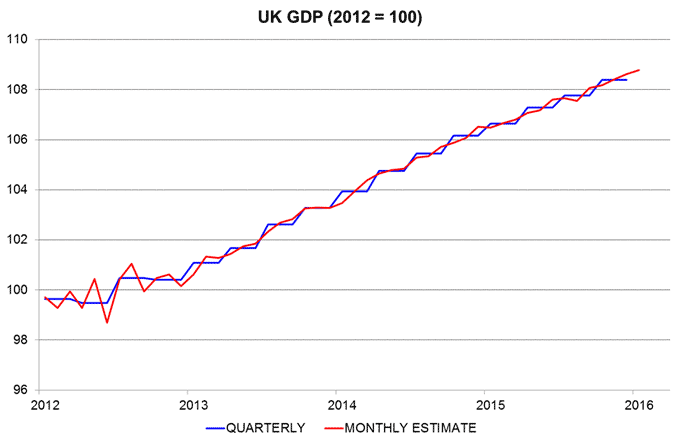
Strong services momentum has carried over into the first quarter, as suggested by January turnover data discussed in the earlier post. Services output rose by a monthly 0.2% in January to stand 0.5% above the fourth-quarter level. Also taking into account industrial and construction output data, GDP in January was an estimated 0.4% higher than in the fourth quarter – see first chart. Growth for the first quarter as a whole, therefore, is on course to match or beat the 0.6% fourth-quarter gain.
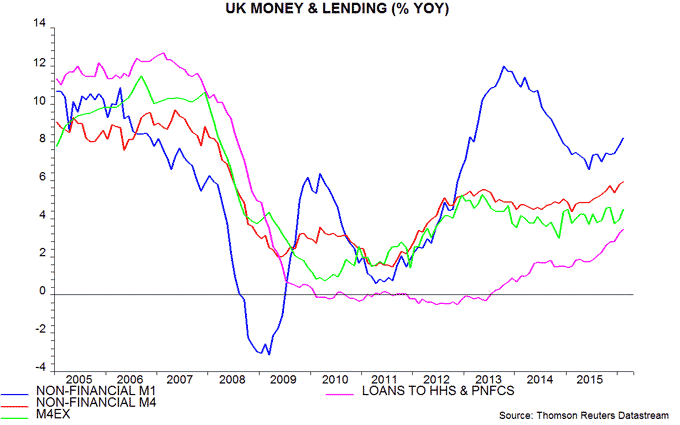
Recent stronger economic performance was foreshadowed by a pick-up in money and credit growth during 2015. This pick-up has extended in early 2016. The preferred narrow and broad aggregates here are non-financial M1 and M4, covering money holdings of households and private non-financial corporations (PNFCs)*. Annual growth of non-financial M1 was 8.2% in February, a 15-month high. Annual non-financial M4 growth rose to 5.9%, the fastest since June 2008 – second chart.
The Bank of England’s favoured broad aggregate, M4ex, is growing more slowly – an annual 4.5% in February. This reflects its inclusion of money holdings of non-bank financial institutions (excluding intermediaries), which fell by 4.1% in the latest 12 months. Such holdings are less relevant for judging near-term spending prospects.
Credit trends, meanwhile, continue to strengthen, with annual growth of bank lending to households and PNFCs up to 3.4% in February, the fastest since March 2009 – second chart. Total bank credit to the private sector (i.e. M4ex lending, including credit extended to non-bank financial institutions) rose by 4.8% in the latest 12 months.
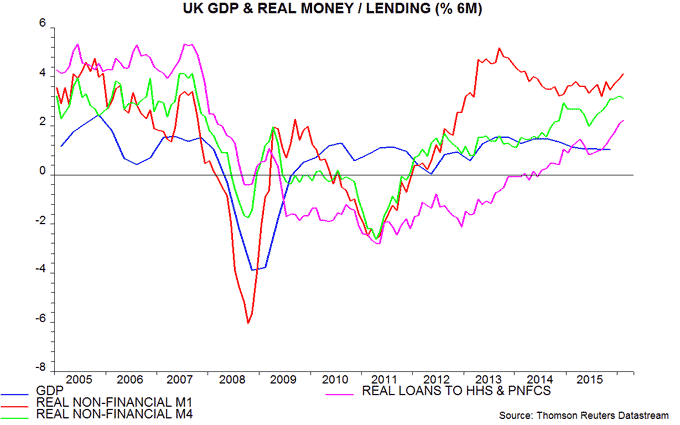
The “best” monetary forecasting indicator, in terms of reliability in signalling GDP turning points over the last 50 plus years, is real (i.e. inflation-adjusted) non-financial M1. Six-month growth of this measure fell between September 2013 and November 2014 ahead of a moderation in two-quarter GDP expansion between the third quarter of 2014 and the second quarter of 2015 – third chart. Real money growth, however, has risen since September 2015 and the GDP / output data discussed above suggest that the economy is already responding, with stronger momentum likely to extend into the summer, at least.
The gloomy consensus forecast of GDP growth of only 2.0% in 2016 seems to assume that Brexit uncertainty will weigh on spending, even if the June referendum delivers a remain result. Any such drag, however, has arguably been more than offset by the MPC delaying further a rise in interest rates and associated exchange rate weakness.
In other news today, the current account deficit widened to £32.7 billion, or a record 7.0% of GDP, in the fourth quarter of 2015. The shortfall, however, was more than offset by a valuation gain on existing stocks of assets and liabilities: the net international investment position (NIIP) improved from -£185.5 billion to -£65.9 billion over the quarter. The NIIP has risen by £60.8 billion over the last five years despite a cumulative current account deficit of £311.3 billion.
*M1 = notes / coin plus sight deposits. M4 = M1 plus other sterling deposits, repos and short-maturity bank paper.