Hard landing watch: recent data wrap
 Simon Ward
 1 Comment
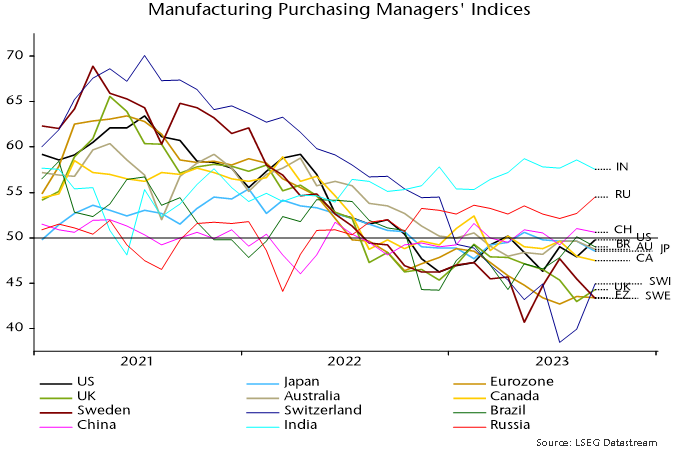
October flash PMI results for major developed economies imply little change in the global composite PMI new orders index (released 6 November). The current index level is 1 standard deviation below the long-run average. Weakening real narrow money momentum suggests a further decline through end-Q1 2024 – see previous post.
What to make of the US GDP surge of 4.9% annualised in Q3? Likely temporary factors contributed (strong government spending, a rebound in stockbuilding). National accounts numbers have jarred with talk of economic strength since end-2021: GDP rose at an annualised rate of 1.2% over the six quarters to Q2 2023, with growth of the alternative income measure at just 0.2%. The Q3 GDP number may represent a statistical catch-up (an income estimate will be released next month).
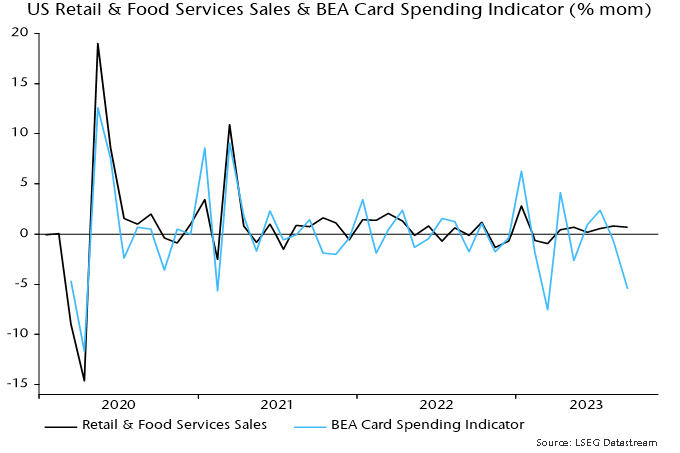
Retail sales / consumption strength is difficult to reconcile with the BEA’s near real-time data on card spending – see chart 1. Similarly, the GDP number appears out of line with PMIs and moderate Q3 growth in private aggregate hours worked (1.7% annualised).
Chart 1
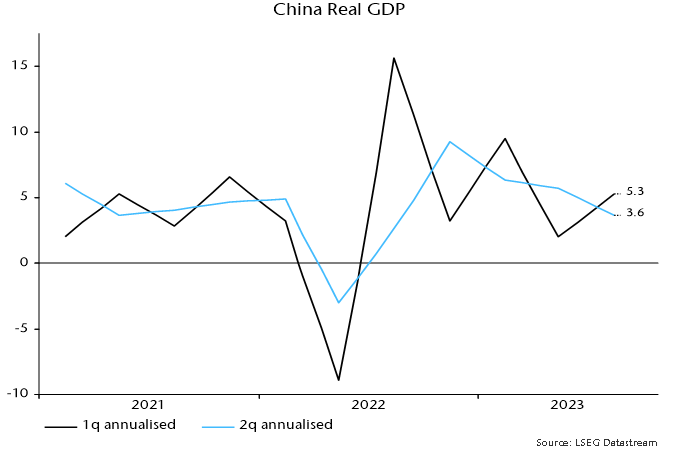
Chinese Q3 GDP growth also surprised to the upside but is easier to explain – as payback for a weak Q2. The two-quarter rate of change fell again – chart 2. A decline in six-month real narrow money momentum during Q3 suggests a further slowdown into early 2024.
Chart 2
Verdict: PMIs consistent with soft or hard landing; US GDP strength temporary / erratic; China losing momentum.
Food correction to sustain rapid UK / Eurozone inflation decline
Changes in household energy bills will cut 1.6 percentage points (pp) from UK annual CPI inflation between September and October, implying a drop from 6.7% to 5.1% if annual rates of increase of other components are unchanged. Slowing food prices promise to lop a further 1.5 pp off annual inflation by early 2024, both directly and via pass-through to the important catering services component. So a minimum expectation is that the headline rate will be back at about 3.5% by next spring, before allowing for likely moderation in other inflation components.
The energy bill effect in October reflects the dropping out of a 25% increase in October 2022 along with a 7% cut in the price cap this month. The annual rate of change will swing from 6% in September to -22%. A simple calculation would suggest a 1.3 pp impact on headline CPI inflation, i.e. the 28 pp swing multiplied by a published weight of 4.8%. It turns out that the actual impact is larger because of the way that monthly price changes have interacted with variations in the weight due to relative price movements and basket revisions.
Annual inflation of food, beverages and tobacco has moderated but was still up at 11.8% in September. The CPI measure tracks the corresponding PPI component, annual inflation of which is now below 5% (4.5% in September) – see chart 1.
Chart 1
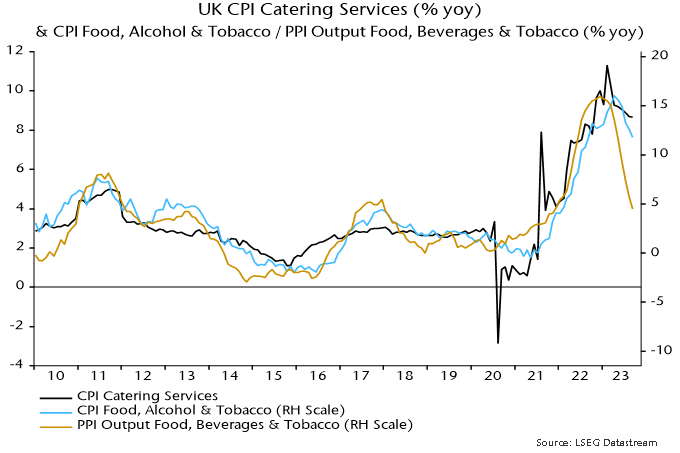
A fall in annual inflation of the CPI food measure to 5% by early 2024 would suggest a 1.1 pp impact on the headline rate, i.e. the 6.8 pp fall from the September multiplied by a published weight of 16.1%*.
As the chart shows, however, food prices are also a key driver of the catering services component, which has a 10.9% weight. The beta of this component to food prices has been about 0.5 historically, i.e. the suggested fall of 6.8 pp in annual food inflation would be expected to lower catering services inflation by 3.4 pp, cutting a further 0.4 pp from the headline rate.
Central bankers and commentators worried about sticky services inflation underestimate the pass-through effects of energy and food prices. Catering services accounts for 23.4% of the services basket, so the suggested 3.4 pp drop in the annual increase would cut 0.8 pp from annual services inflation (6.9% in September).
The above analysis also applies to the Eurozone, although the estimated impacts are smaller because annual inflation of food, beverages and tobacco is lower than in the UK, i.e. 8.8% versus 11.8% in September.
As in the UK, a slowdown in the corresponding PPI component suggests a fall in annual food inflation to 5% soon – chart 2. A 3.8 pp reduction would imply a 0.8 pp cut in headline inflation, based on a 20.0% weight.
Chart 2
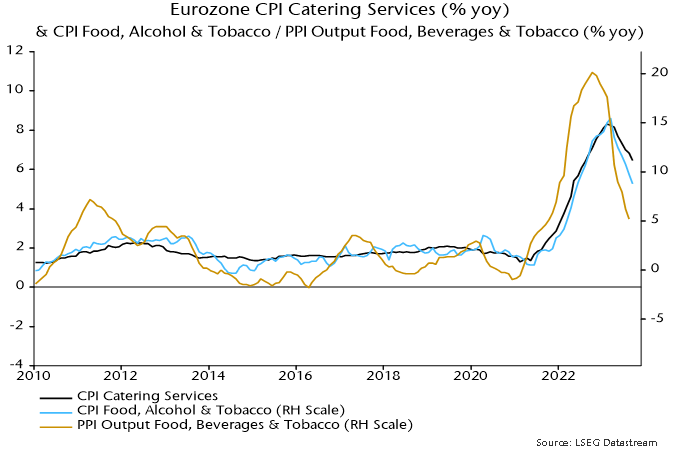
Eurozone catering services inflation also has a beta of about 0.5 to food prices, so could fall by 1.9 pp. This would cut a further 0.2 pp from the headline rate and 0.4 pp from services inflation (based on weights of 8.4% and 19.2% in the overall and services baskets respectively).
So the combined direct and indirect effects of the food slowdown on CPI inflation would be about 1.0 pp in the Eurozone against 1.5 pp in the UK.
*As with the energy effect, a detailed calculation yields a slightly larger impact.
More negative monetary news
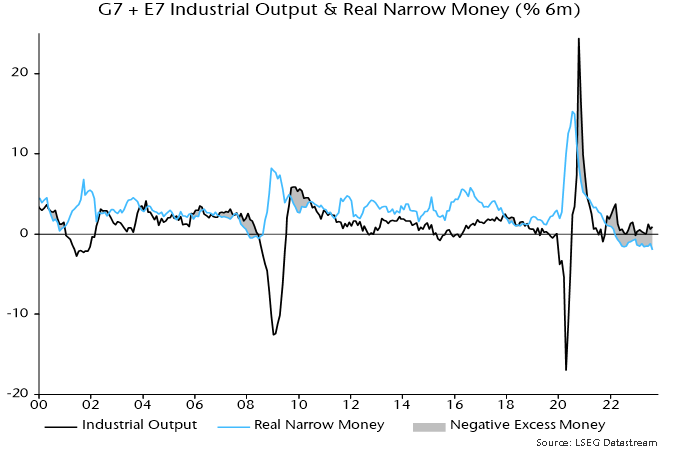
Global six-month real narrow money momentum – a key leading indicator in the forecasting approach employed here – is estimated to have fallen to another new low in September. Real money momentum has led turning points in global PMI new orders by an average 6-7 months historically, so the suggestion is that a recent PMI slide will extend through end-Q1 – see chart 1.
Chart 1
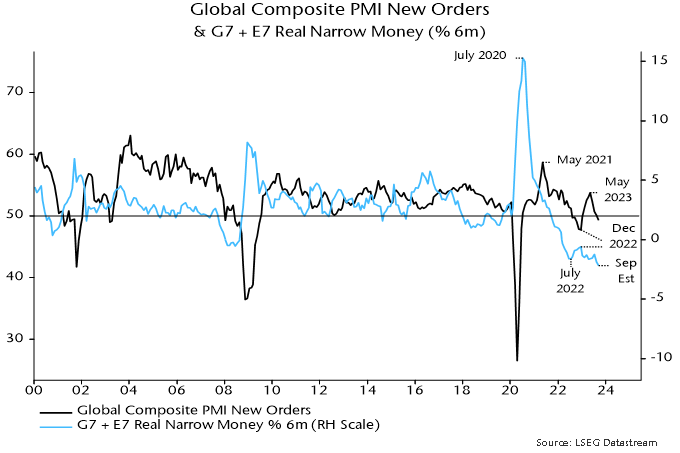
The September real narrow money estimate is based on monetary data for countries with a two-thirds weight in the global (i.e. G7 plus E7) aggregate and CPI data for a higher proportion.
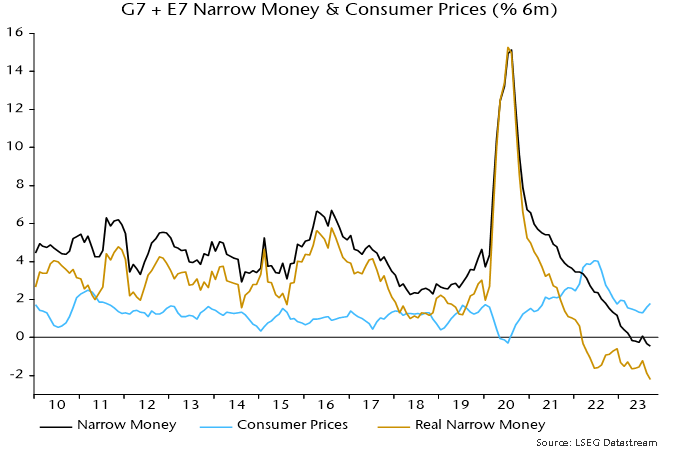
The estimated September fall reflects additional nominal money weakness coupled with a further oil-price-driven recovery in six-month CPI momentum – chart 2.
Chart 2
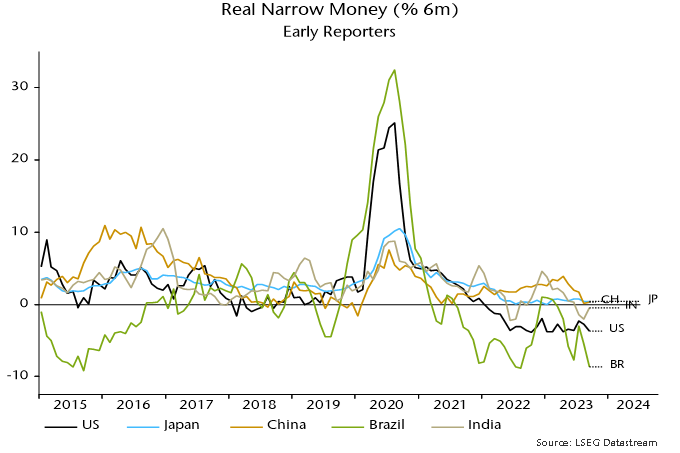
Among countries that have released September data, six-month real narrow money momentum fell in the US and Brazil, was little changed in China / Japan and recovered in India (because inflation reversed lower after a food-driven spike) – chart 3.
Chart 3
Real narrow money momentum is primarily a directional indicator but the current extreme negative reading seems unlikely to be consistent with hopes of a “soft landing”.
One argument for the latter is that a drag on manufacturing trade and activity from a downswing in the stockbuilding cycle is coming to an end, to be followed by a recovery into 2024. A trough by end-2023 has long been the base case here but monetary weakness suggests that the cycle will bump along the bottom rather than enter an upswing.
More precisely, an initial boost from an ending of destocking may fizzle as the usual multiplier effects are offset by slower or falling final demand due to monetary restriction.
Stockbuilding cycle upswings historically were always preceded by a recovery (of variable magnitude) in global real narrow money momentum – chart 4.
Chart 4
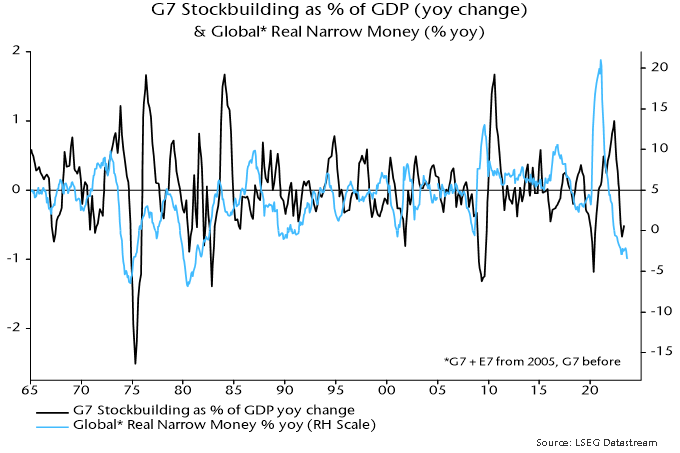
Current conditions are reminiscent of the early 1990s, when real money momentum remained near its low between H2 1989 and H1 1991 and an easing of a stockbuilding drag in 1990 was followed by a relapse into 1991. Monetary weakness, on that occasion, appears to have resulted in an extended cycle, with a final low in Q2 1991 occurring 4 1/2 years after the previous trough in Q4 1986 versus an average cycle length of 3 1/3 years. For comparison, the current cycle started in Q2 2020 so has recently moved beyond the 3 1/3 year average.
Hard landing watch: US employment report
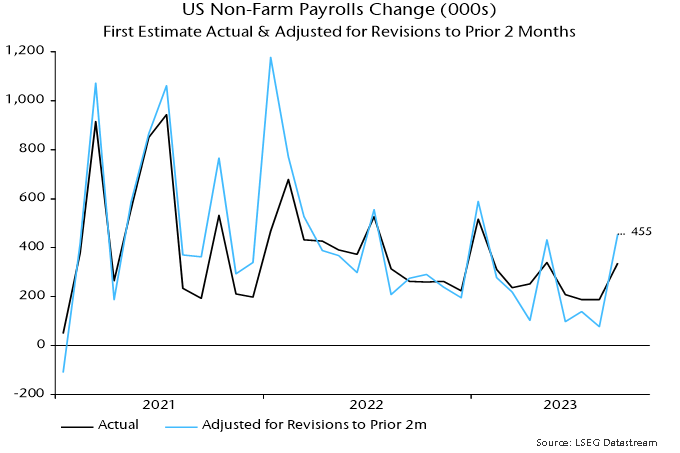
US September non-farm payrolls blew through the consensus expectation but the totality of evidence from the employment report suggests that the labour market continues to cool.
Including upward revisions to the prior two months, 455,000 jobs were added to the payrolls tally in September. However, this follows three weak months when the revisions-adjusted gain averaged 105,000 – see chart 1.
Chart 1
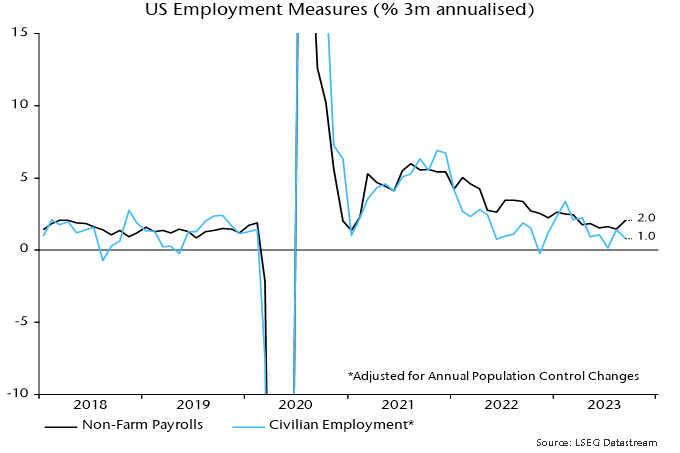
The alternative household survey employment measure – which counts people rather than jobs – grew at half the pace of payrolls in the three months to September – chart 2.
Chart 2
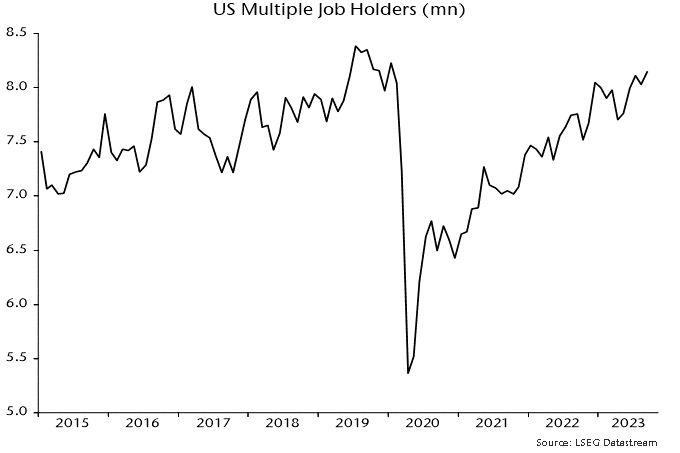
The relative strength of payrolls partly reflects a further rise in multiple job-holding, which is approaching its pre-pandemic peak, i.e. the relative boost may be ending – chart 3.
Chart 3
Stepping back, stronger growth of payrolls than GDP since end-2021 represents a catch-up following a big undershoot of trend during the pandemic – chart 4.
Chart 4
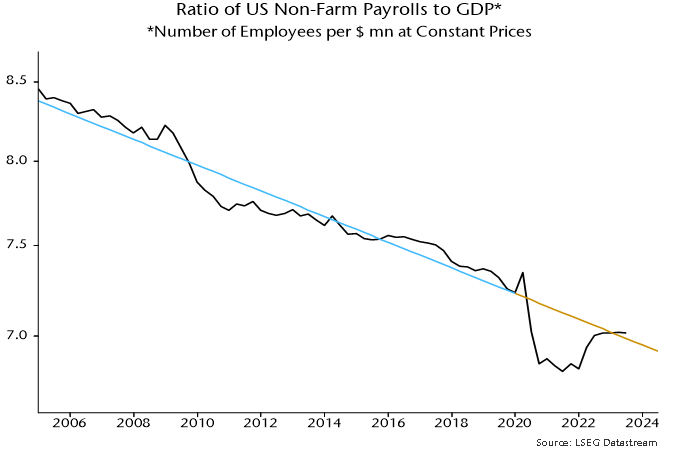
The catch-up appears complete, suggesting that payrolls will resume slower growth than GDP. The slope of the trend line implies a fall in payrolls if GDP growth declines below 1% annualised.
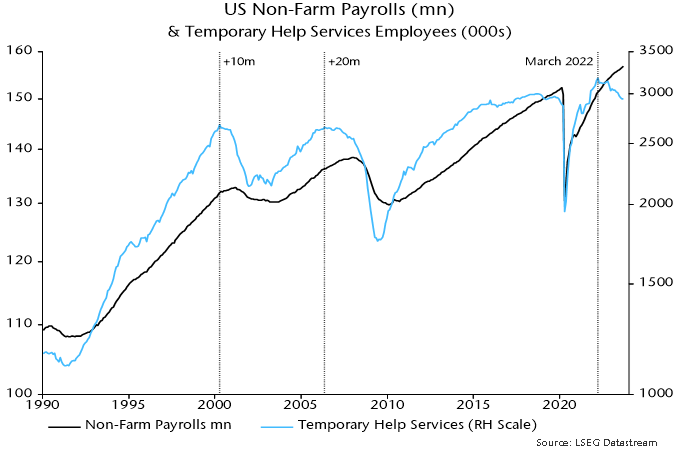
Temporary help jobs have led at prior peaks and troughs in payrolls and continued to decline in September – chart 5.
Chart 5
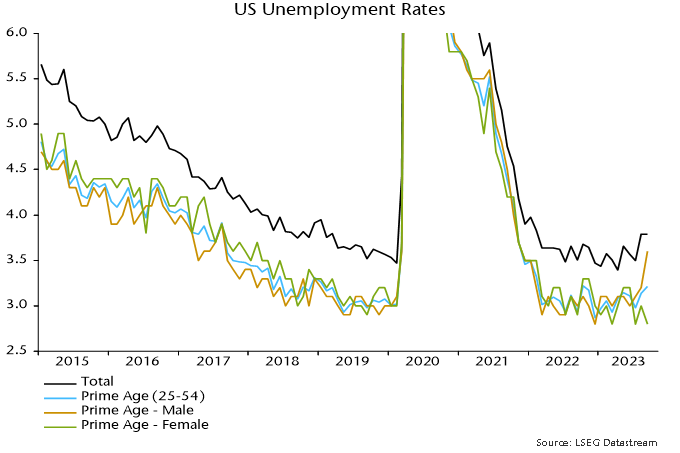
The unemployment rate, meanwhile, held at its higher August level, with the demographic breakdown showing a sharp jump among prime-age males – chart 6.
Chart 6
Verdict: neutral / negative – headline surprise offset by weaker internals.
A "monetarist" perspective on current equity markets
Global monetary trends appear inconsistent with economic expansion and recent levels of financial asset prices. Central banks are likely to be forced to reconsider policy stances, by market / financial instability and / or unexpected economic weakness.
Key developments during Q3 included:
-
Global composite PMI new orders – a timely indicator of economic momentum – extended a decline from a local peak in May.
-
Global six-month real narrow money momentum fell to a new low, suggesting a further PMI slide into early 2024 – see chart 1.
-
Inflation news was favourable, with US and Eurozone core momentum slowing significantly.
-
Major central banks ignored these developments, tightening policies further and signalling “higher for longer”.
-
Hopes that Chinese easing would act as a counterweight to G7 restriction were dashed by the PBoC allowing money rates to firm significantly into quarter-end, perhaps reflecting concern about capital outflows.
-
Global “excess” money momentum, as measured by the differential between six-month rates of change of real narrow money and industrial output, became more negative – chart 2.
-
The stock of excess money, i.e. the ratio of real narrow money to industrial output, fell to its lowest level since February 2020 before the covid policy response and associated monetary surge.
-
US real Treasury yields extended a third major move higher since late 2021, interpreted here as reflecting the intensified excess money squeeze coupled with higher for longer guidance.
-
Global equities gave back most of their Q2 gain as higher real yields dragged valuations lower.
-
The yield surge contributed to underperformance of growth and non-US quality while restraining outperformance of defensive sectors.
Chart 1
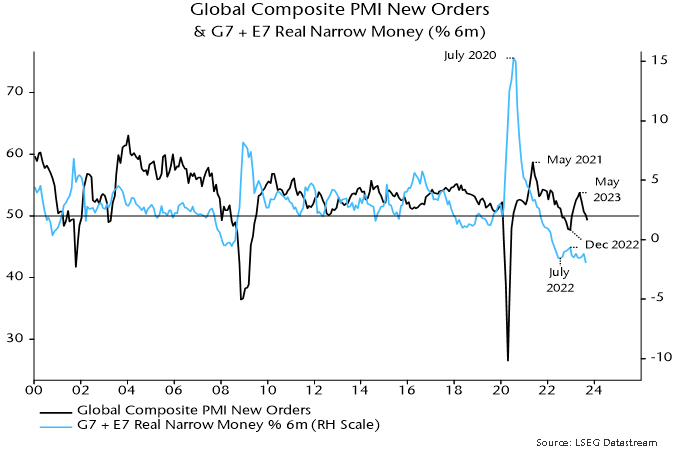
Chart 2
Current and prospective monetary trends appear too weak to support recent levels of economic activity and market wealth. Two scenarios for relieving the monetary shortage may be considered.
In the better scenario, a further fall in inflation coupled with modest weakness in activity results in global excess money contraction moderating into end-2023, with an associated reversal lower in real yields. (Equity market performance is related to the sign of the level of excess money momentum while yield movements are related to the sign of the rate of change.)
Inflation progress and softer labour market data prompt central banks to retract higher for longer guidance and cut rates in early 2024, extending the move lower in yields. Falling yields support growth and quality, limiting weakness in equity indices.
Lower rates revive nominal money momentum in H1 2024, laying the foundation for an economic recovery during H2. Inflation continues to fall as core / wage pressures fade, moving to an undershoot in late 2024 / 2025 in lagged reflection of monetary weakness in 2022 / 2023.
Equity markets recover during H1 2024 as excess money momentum turns positive. Near-term outperformance of defensive sectors reverses as improving economic prospects for late 2024 / 2025 lift cyclical areas.
The suggestion in this scenario of modest / short-lived economic contraction is consistent with the cyclical analysis framework employed here: major downturns in the housing and business investment cycles are not expected before 2025, while the stockbuilding cycle is scheduled to recover in 2024.
In the worse scenario, recent policy tightening and surging yields result in a further fall in nominal money momentum, offsetting the impact of lower inflation and declining activity on real / excess trends.
Real yields are stickier and equity markets fall further, with defensive sectors outperforming significantly.
Intensified economic weakness and an ongoing monetary shortage trigger one or more credit “events”, raising financial stability concerns. Central banks cut rates but are viewed as having lost control. Investors price in a tail risk of excessive easing and another inflation surge later in the decade.
Inflation falls faster and further than in the better scenario, contributing to a larger eventual decline in rates and Treasury yields. The beneficial effect on monetary trends, however, is delayed by “endogenous” tightening via wider credit spreads and wealth losses.
The suggestion in this scenario of significant multi-quarter G7 recessions could be reconciled with the cycles framework by arguing that the rate shock advanced the housing cycle peak expected around 2025, i.e. the downswing will play out over 4-5 years rather than a more normal 2-3.
The subjective probabilities assigned here to the two scenarios will be adjusted in response to incoming nominal money data.
The further fall in global six-month real narrow money momentum in Q3 was mainly attributable to declines in China and India, confirming a need for PBoC easing and questioning consensus optimism about Indian economic prospects. Momentum remains weaker in Europe than the US – chart 3.
September manufacturing PMI results are broadly consistent with the real money momentum ranking – chart 4 (rank correlation coefficient = 0.76). Minor anomalies include India, Brazil and Switzerland (downside risk to current PMI ranking suggested by money trends), and Japan and Sweden (upside).
Chart 3
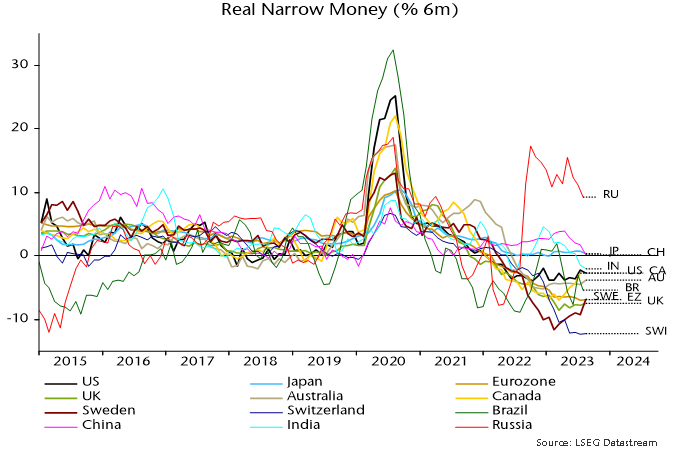
Chart 4