
Why investors should fade a possible ISM bounce
 Simon Ward
 1 Comment
A bottoming out of the global stockbuilding cycle could be associated with a near-term recovery in manufacturing survey indicators. Money trends suggest that any revival will be modest / temporary and offset by wider economic weakness.
Economic news has been unusually mixed since end-2021, with GDP weakness contrasting with labour market strength and manufacturing deterioration offset by services resilience. Confusing signals have contributed to market hopes of a “soft landing”.
Sectoral and regional divergences may persist in H2 2023. The expectation here is that manufacturing survey weakness will abate but labour market data will worsen significantly. Money trends continue to cast strong doubt on soft landing hopes. Europe is likely to underperform the US.
The US ISM manufacturing new orders index – a widely watched indicator of industrial momentum – hit a low of 42.5 in January and retested this level in May before recovering to 45.6 in June.
Reasons for expecting a further rise include:
-
The index has been in the 40s since September 2022 and the mean duration of sub-50 periods historically was eight months (ignoring episodes of three months or less).
-
The global stockbuilding cycle remains on track to bottom out during H2 2023 and lows historically were usually preceded by a recovery in US / global manufacturing new orders.
-
Recent price falls for raw materials and other production inputs may further incentivise firms to step up purchasing to maintain or replenish inventories.
Korean manufacturing is a bellwether of US / global trends and the latest Federation of Korean Industries survey reported a marked improvement in optimism, consistent with ISM new orders moving back above 50 – see chart 1.
Chart 1
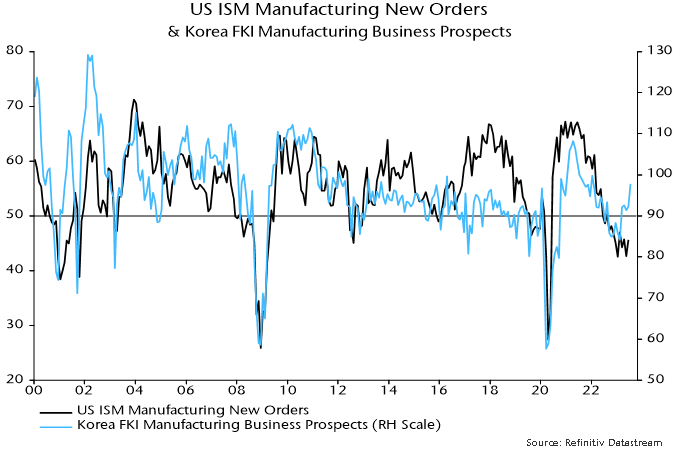
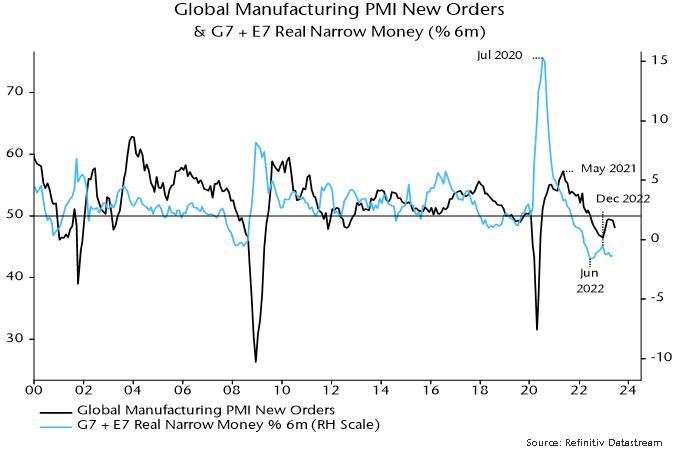
Sustained recoveries in ISM new orders from the mid 40s into expansionary territory historically occurred against a backdrop of positive and / or rising six-month real narrow money* momentum. Current trends are unfavourable, with momentum still significantly negative and moving sideways – chart 2.
Chart 2
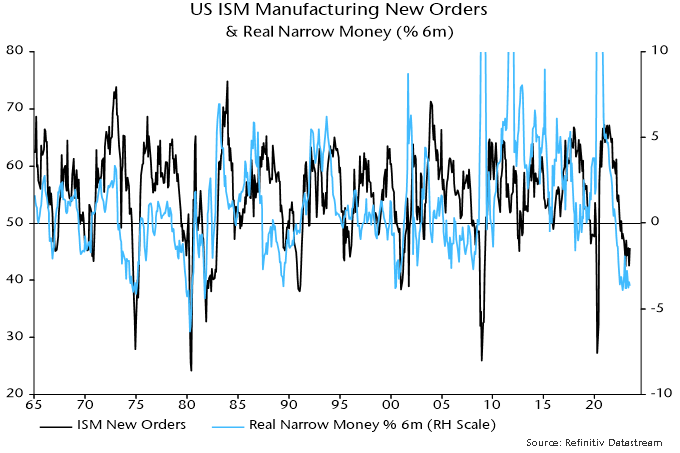
Examples of recoveries to above 50 without a supportive monetary backdrop include 1970 and 1989-90. In both cases the rise was modest (peaking below 55), short-lived and followed by a decline to a lower low. The recovery in 1970 occurred within an NBER-defined recession and in 1989-90 just before one.
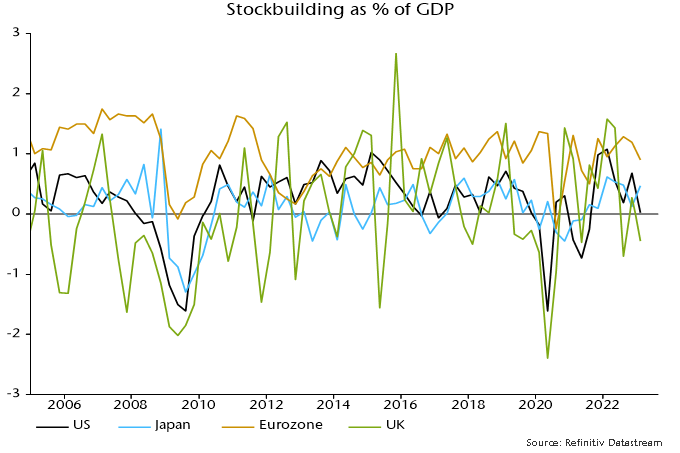
An ISM rebound might not be mirrored by much if any revival in European manufacturing surveys. Money trends are even weaker than in the US, while the stockbuilding adjustment started later in the Eurozone and probably has further to run – charts 3 and 4.
Chart 3
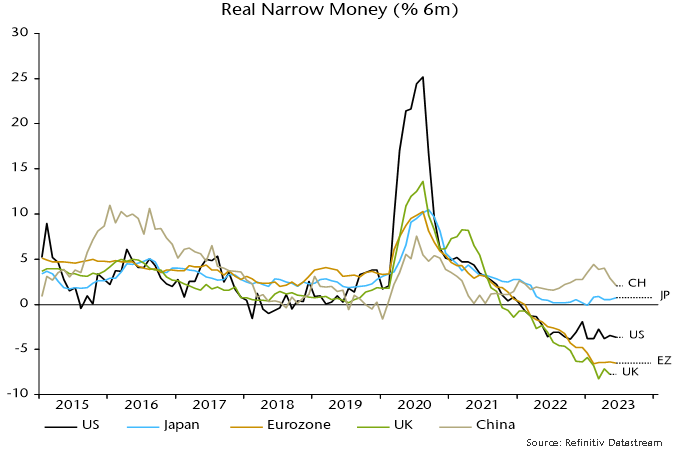
Chart 4
*Narrow money definition used here = M1A = currency + demand deposits.
Why UK inflation underperformance could be ending
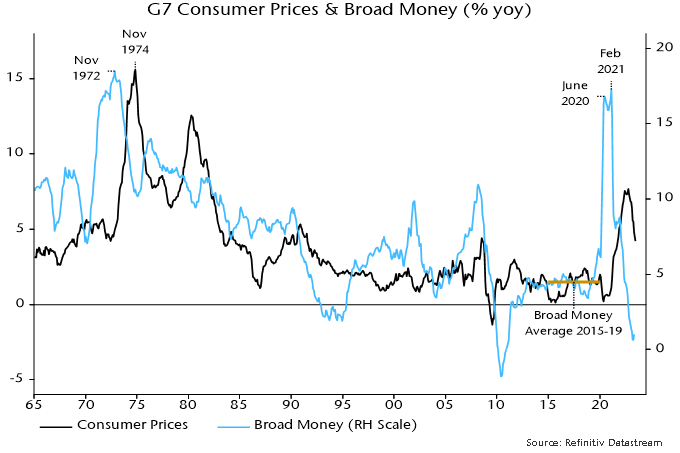
UK headline CPI momentum continues to track a simplistic “monetarist” forecast based on the profile of broad money momentum two years earlier.
Six-month growth of headline prices, seasonally adjusted, peaked at 12.7% annualised in July 2022 and had halved to 6.5% as of June. This mirrors a halving of six-month broad money momentum from a peak of 20.5% annualised in July 2020 to 10.5% in June 2021 – see chart 1.
Chart 1
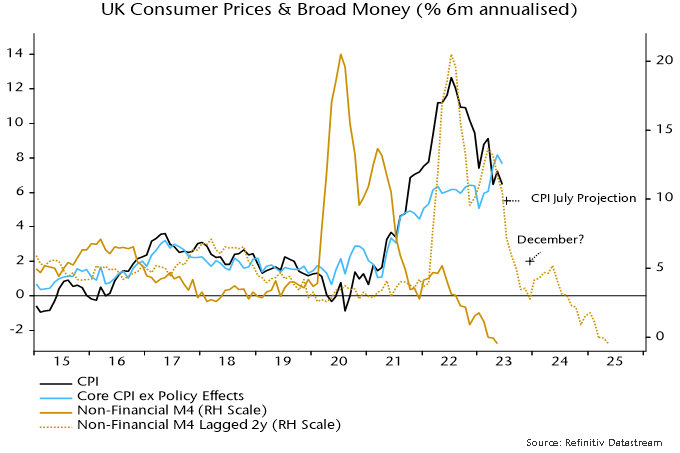
Broad money continued to slow sharply during H2 2021, with six-month momentum down to 2.7% by December, suggesting a fall in six-month CPI momentum to 2% annualised or lower by late 2023 / early 2024.
A 2% rate of increase of prices during H2 2023 could be achieved by the following combination:
The energy price cap falling by a further 10% in October, in line with current estimates based on wholesale prices, following the 17% July reduction.
Food, alcohol and tobacco prices slowing to an 8% annual inflation rate by December from 14.9% in June.
Core prices rising at a 4% seasonally adjusted annualised rate during H2 2023, down from 7.7% in H1.
The latter two possibilities are supported by producer output price developments – annual inflation of food products is already down from a 16.8% peak to 8.7%, while core output prices flatlined during H1, following a 6.4% annualised rise during H2 2022.
A 2% annualised CPI increase during H2 2023 would imply a headline annual rate of about 4% by year-end, well with PM Sunak’s target of a halving from 10%+ levels, although he will have made no contribution to the “success”.
Why has UK CPI inflation exceeded US / Eurozone levels, both recently and cumulatively since end-2019?
The assessment here is that the divergence reflects relatively weak UK supply-side economic performance and a larger negative terms of trade effect, rather than more egregious monetary excess.
Charts 2 and 3 show that UK / Eurozone broad money expansion since end-2019 has been similar and less than in the US, with the relative movements mirrored in nominal GDP outcomes.
Chart 2
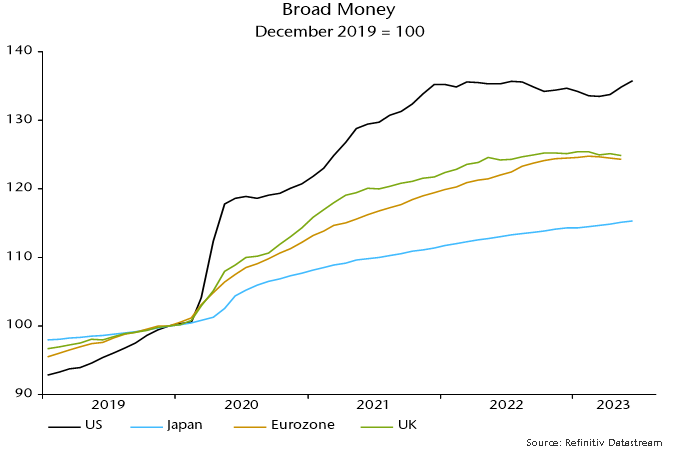
Chart 3
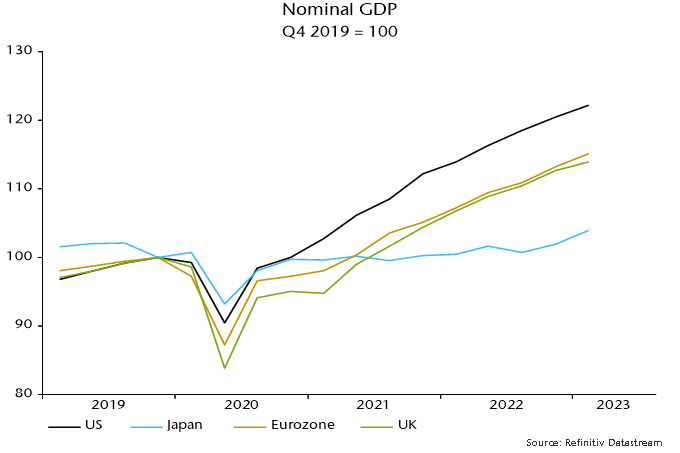
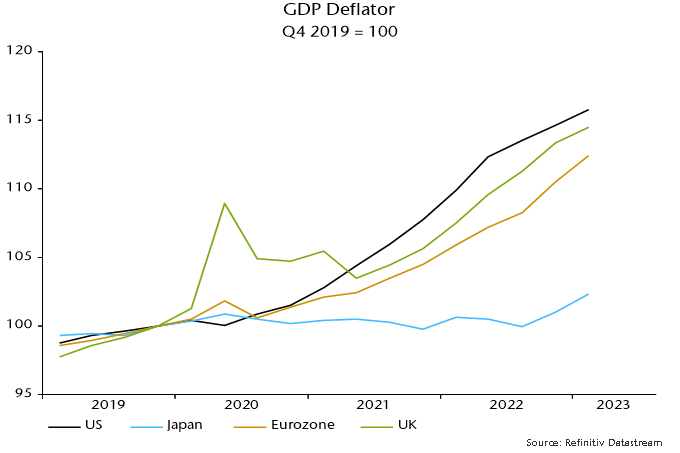
The UK has, however, underperformed the US and Eurozone in terms of the division of nominal GDP expansion between real GDP and domestically-generated inflation, as measured by the GDP deflator – charts 4 and 5.
Chart 4
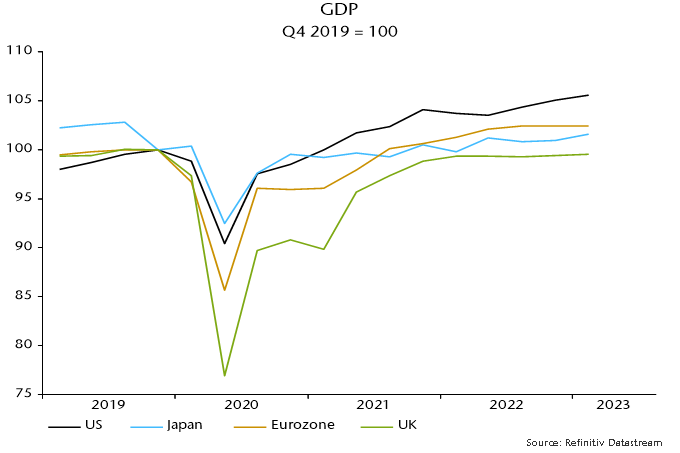
Chart 5
UK consumer prices were additionally boosted relative to the US by opposite movements in the terms of trade (i.e. the ratio of export to import prices), reflecting different exposures to energy prices as well as currency movements (i.e. a strong dollar through last autumn) – chart 6.
Chart 6
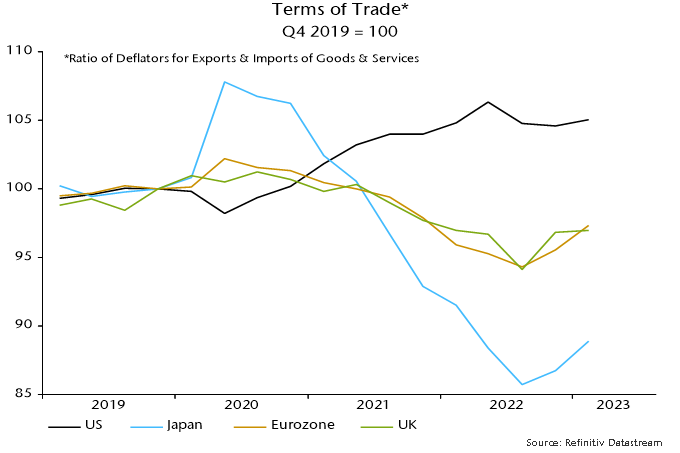
UK supply-side weakness may be structural but monetary and terms of trade considerations suggest an improvement in UK relative inflation performance – annual broad money growth is now similar to the US and below the Eurozone level, while sterling appreciation since late 2022 may extend a recent recovery in the terms of trade.
"Sahm rule" signalling UK wages slowdown
The Sahm rule states that the (US) economy is likely to be in recession if a three-month moving average of the unemployment rate is 0.5 pp or more above its minimum in the prior 12 months.
The rule identified all 12 US recessions since 1950 but gave two false positive signals based on current (i.e., revised) unemployment rate data (1959 and 2003) and four based on real-time data (additionally 1967 and 1976).
The signal occurred after the start date of the recession in all 12 cases, with a maximum delay of seven months* (in the 1973-75 recession).
The Sahm condition hasn’t yet been met in the US – the unemployment rate three-month average was 3.6% in June versus a 12-month minimum of 3.5%.
The rule has, however, triggered a warning in the UK, where the jobless rate averaged 4.0% over March-May, up from 3.5% over June-August 2022.
UK Sahm rule warnings occurred on nine previous occasions since 1965, six of which were associated with GDP contractions.
The Sahm signal is another indication that the UK economy is already in recession – see previous post – but a stronger message is that earnings growth is about to slow.
Annual growth of average earnings fell after the Sahm signal in eight of the nine cases, the exception being the 2020 covid recession, when earnings numbers were heavily distorted by composition effects – see chart 1.
Chart 1

Previous generations of monetary policy-makers understood the dangers of basing decisions on the latest inflation and / or earnings data, which reflect monetary conditions 18 months or more ago.
The current reactive approach, apparently endorsed by the economics consensus, may partly reflect mythology about a 1970s “wage / price spiral”. Rather than causing each other, high wage growth and inflation were dual symptoms of sustained double-digit broad money expansion.
The monetarist case is summarised by chart 2, showing that earnings growth is almost coincident with core inflation whereas broad money expansion displays a long lead. (The correlations with core inflation are maximised with lags of four months for earnings growth and 24 months for money growth.)
Chart 2

Recent monetary weakness argues that core inflation and wage growth will be much lower by late 2024; the Sahm rule signals that the decline is about to start.
*Eight months taking into account a one-month reporting lag.
A "monetarist" perspective on current equity markets
Monetary and cycle aspects of the forecasting approach used here are currently in tension. Global real narrow money trends suggest a renewed weakening of economic momentum into late 2023. Cyclical forces, however, are scheduled to become more supportive from early 2024 as the stockbuilding cycle bottoms out and moves into a recovery phase.
The two messages can be reconciled if real money momentum recovers over the remainder of 2023, confirming an improving outlook for 2024. Momentum is expected to be lifted by a further slowdown in inflation but a sufficient recovery is unlikely without a policy reversal by major central banks. Current signals are that such a reversal will require a dramatic deterioration in economic data and / or major market weakness.
Economic news has been confusing, allowing optimists and pessimists to claim support for their assessments. Weakness appears the correct interpretation based on national accounts data. An average of the expenditure and income measures of US GDP rose at an annualised rate of only 0.3% in the five quarters to Q1 2023. The monthly measure of UK gross value added has flatlined since last summer while Eurozone GDP slipped into contraction in Q4 / Q1.
Claims of economic resilience or even strength focus on solid employment growth and tight labour markets. Weak GDP expansion has been unusually jobs-rich because of a rebound in the share of lower-productivity services activities. With the goods / services split normalising, this composition boost is probably ending.
GDP / employment divergence has been echoed in PMIs, with manufacturing weakness balanced by services strength. Again, the assumption here is that services exceptionalism is temporary, reflecting a later release of pent-up demand, suggesting focusing on manufacturing as a better guide to trend.
The global manufacturing PMI new orders index reached a 31-month low in December 2022, recovering modestly into the spring before falling back sharply in June. A revival and relapse had been signalled by six-month real narrow money momentum, which recovered during H2 2022 but eased again in early 2023. The recent slide extended into May, suggesting further PMI weakness into late 2023 – see chart 1.
Chart 1
Monetary alarm bells are ringing loudest in Europe. Six-month rates of contraction of Eurozone and UK nominal narrow money quickened further in May, contrasting with less negative and stabilising US momentum – chart 2. Six-month changes in broad money have also now crossed below zero and the corresponding US change – chart 3. Trends in Sweden and Switzerland are even weaker.
Chart 2
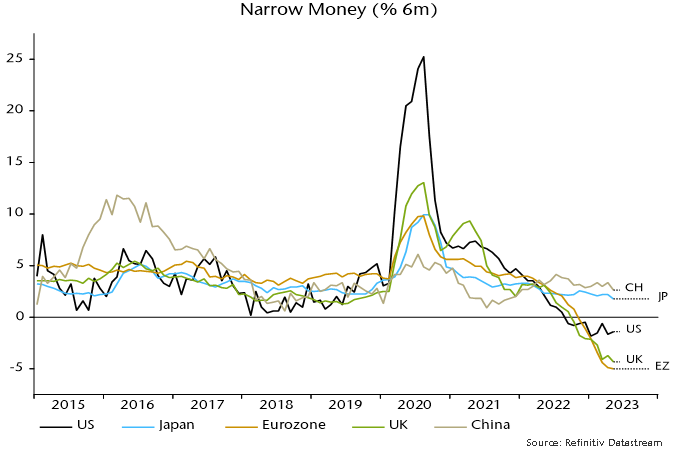
Chart 3
China and India remain positive monetary outliers but narrow money momentum is modest by historical standards and has subsided recently. Relative to monetary trends, the consensus view on China looked overoptimistic at the start of 2023 and appears excessively gloomy now, although further policy easing is warranted to cushion the economy against likely export weakness despite a super-competitive exchange rate.
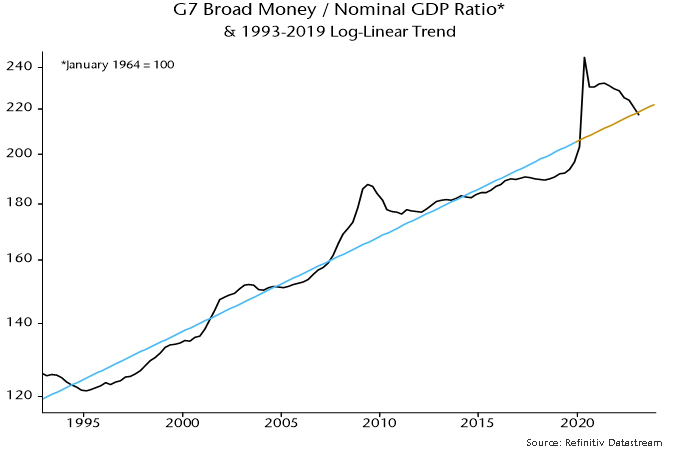
To the extent that the global economy has proved more resilient than expected, one explanation is that the impact of monetary weakness has been delayed by an overhang of “excess” money balances / savings resulting from 2020-21 stimulus. The ratio of G7 broad money to nominal GDP crossed back below its pre-pandemic trend in Q1 2023, suggesting that stock and flow arguments for pessimism are becoming aligned – chart 4.
Chart 4
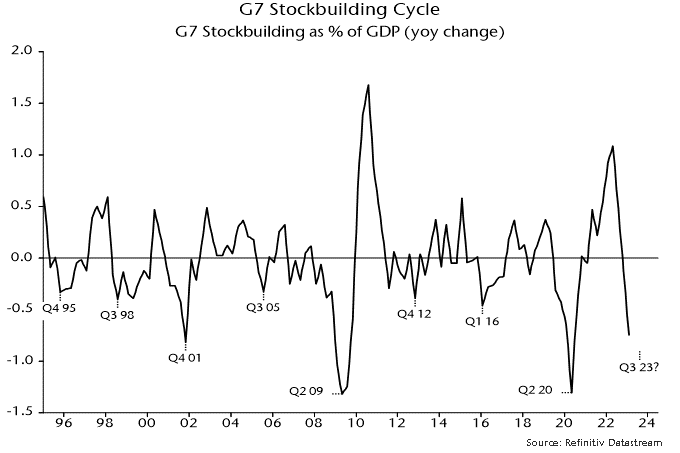
Cycle analysis is used here to provide longer-term context and a cross-check of monetary signals. Economic fluctuations reflect the interaction of three investment cycles: a shorter stockbuilding cycle typically of about 3 1/3 years in duration; an intermediate business investment cycle of 7-11 years; and a longer housing cycle averaging about 18 years.
The business investment and housing cycles last reached lows in 2020 and 2009 respectively. If current cycles are of normal length, the next lows could occur in the late 2020s. Downswings into lows typically play out over 1-3 years so are unlikely to begin before 2025. This suggests that recent softness in housing and business investment represents a temporary correction within ongoing upswings. Current cyclical weakness, on this interpretation, reflects a downswing in the shorter-term stockbuilding cycle, which last bottomed in Q2 2020 and recently entered the time band for another low.
Stockbuilding cycle downswings in isolation are usually associated with global economic slowdowns or at worst recessions that are modest and / or geographically contained. Examples of the latter include the 1970 US recession and the 2011-12 Eurozone downturn. Against a backdrop of monetary weakness and unusually rapid policy tightening, the expectation here has been the current downswing would be more severe and global than the norm.
The cycle analysis suggests, however, that the window for severe economic weakness will begin to close from late 2023. Recent stockbuilding data indicate that the cycle downswing is already well-advanced, consistent with a low being reached before year-end – chart 5. A stockbuilding recovery could combine with continuing upswings in business and housing investment to drive global economic reacceleration in 2024-25. As noted, however, such a scenario requires confirmation from an early recovery in real money momentum, in turn probably dependent on H2 policy reversals.
Chart 5
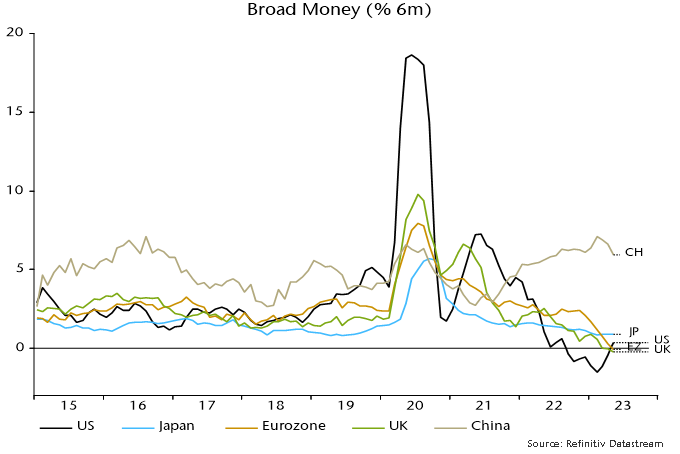
The “monetarist” forecast was that G7 headline CPI inflation would fall rapidly from early 2023, mirroring a large and sustained decline in annual broad money growth from a February 2021 peak. This scenario is playing out: a GDP-weighted average of G7 national headline rates dropped from 6.8% in January to 4.8% in May, with a further decline to 4.2% projected for June – chart 6.
Chart 6
Broad money growth returned to its pre-pandemic average in mid-2022 so – allowing for a standard two-year lead – inflation rates may be back at pre-pandemic (i.e. target-consistent) levels in mid-2024. Recent further monetary deceleration suggests significant risk of an undershoot in late 2024 / 25. The cyclical counterargument is that stockbuilding cycle upswings are usually associated with rising commodity prices, which may support headline rates moving through 2024.
A tendency of policy-makers and commentators to downplay headline progress and focus on stickier core readings is the mirror-image of 2021 claims that a headline surge was “transitory”. Disinflation is following the usual sequence from commodities to goods to lagging services / wages. Recent US / Eurozone data confirm a downshift in short-term core momentum, e.g. US “super-core” consumption prices – ex. food, energy, housing and used cars – rose by an annualised 3.1% between February and May, the smallest three-month gain since December 2020.
The two global “excess” money indicators calculated here – the gap between six-month real narrow money and industrial output momentum, and the deviation of 12-month real narrow money momentum from a slow moving average – have been negative in most months since the start of 2022, suggesting an unfavourable backdrop for equity markets. Despite a strong H1 rally, the MSCI World index was 8.2% below its closing 2021 level at end-June. Cyclical sectors (including tech) lagged defensive sectors (including energy) over this period.
An earlier hope that the first measure – the real money / output momentum gap – would turn positive during H1 was dashed by a combination of renewed monetary weakness and a production boost from an easing of supply constraints. With June global manufacturing PMI results signalling output contraction, a cross-over remains possible soon. The second measure – the deviation of real money momentum from a moving average – is further from a switch.
Historically, equity markets outperformed cash on average only when both measures were positive – still a distant prospect. Both the current negative / negative and possible positive / negative configurations were associated with non-energy defensive sectors outperforming non-tech cyclical sectors.
UK recession gauge in red zone before Q2 rate hikes
A recession likelihood gauge placing weight on monetary variables indicates a high probability of a contraction in UK GDP / gross value added (GVA) over the remainder of 2023.
The indicator, regularly referenced in posts here, is based on a model that generates projections for the four-quarter change in GVA three quarters in advance using current and lagged values of a range of monetary and financial inputs.
Using data up to June 2022, the model assigned a 70% probability to the four-quarter change in GVA being negative in Q1 2023. The current ONS estimate of this change is +0.2%.

The probability reading rises to 96% incorporating data through March 2023, i.e. there is a 96% likelihood of the four-quarter change in GVA in Q4 2023 being negative, according to the model.
The statistical analysis underlying the model indicates that GDP prospects are significantly influenced by movements in real narrow money (non-financial M1) and real corporate broad money (M4). Six-month rates of change of these measures have moved deeper into negative territory since mid-2022.
The model’s increased pessimism also reflects a deepening inversion of the yield curve and falling real house prices. Other inputs include credit spreads and local share prices, which have yet to display recession-scale weakness.