October flash PMI results for major developed economies imply little change in the global composite PMI new orders index (released 6 November). The current index level is 1 standard deviation below the long-run average. Weakening real narrow money momentum suggests a further decline through end-Q1 2024 – see previous post.
What to make of the US GDP surge of 4.9% annualised in Q3? Likely temporary factors contributed (strong government spending, a rebound in stockbuilding). National accounts numbers have jarred with talk of economic strength since end-2021: GDP rose at an annualised rate of 1.2% over the six quarters to Q2 2023, with growth of the alternative income measure at just 0.2%. The Q3 GDP number may represent a statistical catch-up (an income estimate will be released next month).
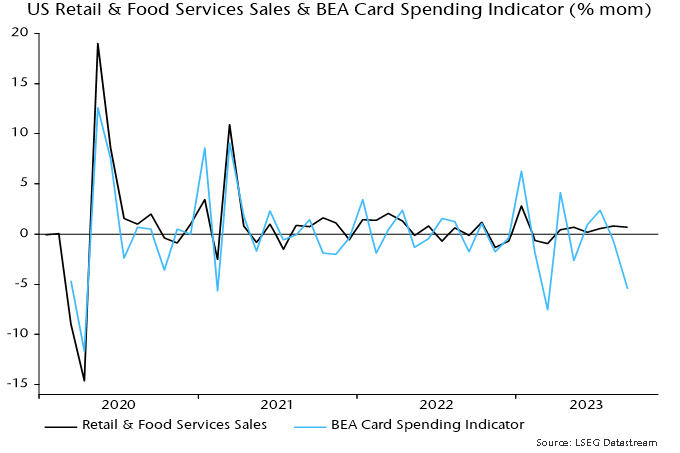
Retail sales / consumption strength is difficult to reconcile with the BEA’s near real-time data on card spending – see chart 1. Similarly, the GDP number appears out of line with PMIs and moderate Q3 growth in private aggregate hours worked (1.7% annualised).
Chart 1
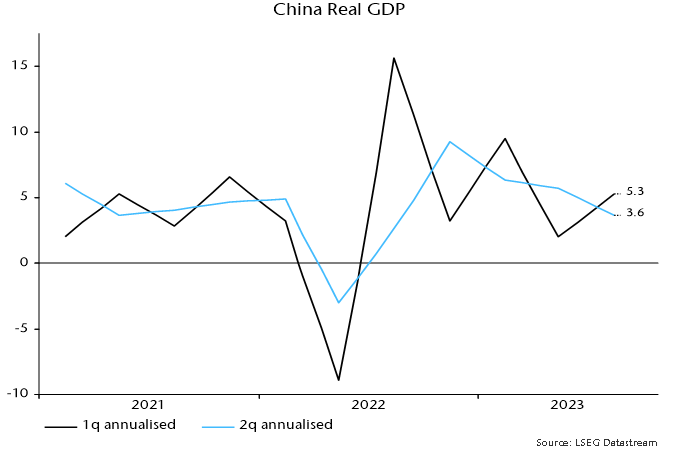
Chinese Q3 GDP growth also surprised to the upside but is easier to explain – as payback for a weak Q2. The two-quarter rate of change fell again – chart 2. A decline in six-month real narrow money momentum during Q3 suggests a further slowdown into early 2024.
Chart 2
Verdict: PMIs consistent with soft or hard landing; US GDP strength temporary / erratic; China losing momentum.