US inflation: is the Phillips curve about to bite back?
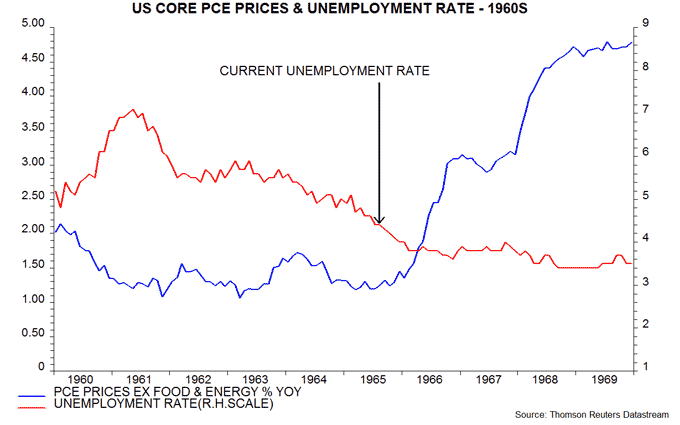
The lack of response of US core inflation to a tightening labour market in recent years echoes experience in the first half of the 1960s. Then, core inflation embarked on a sustained rise only after the unemployment rate fell below 4.5% and then 4% in 1965-66. The jobless rate is currently 4.4% and, on the expectation here of solid economic growth in late 2017 / early 2018, may soon reach 4% or lower. The risk of a “non-linear” inflation response to a further unemployment decline may contribute to the Fed raising rates by more than markets expect by spring 2018.
The three-month rate of change of core consumer prices (i.e. excluding food and energy) rebounded to 1.9% annualised in August, equalling its average over 2012-16. This supports the argument in a previous post that weak core data earlier in 2017 reflected pay-back for an overshoot last winter together with a temporary drag from a large drop in the measured price of wireless telephone services. A narrower core measure excluding such services rose at a 2.1% annualised pace in the latest three months – see first chart.

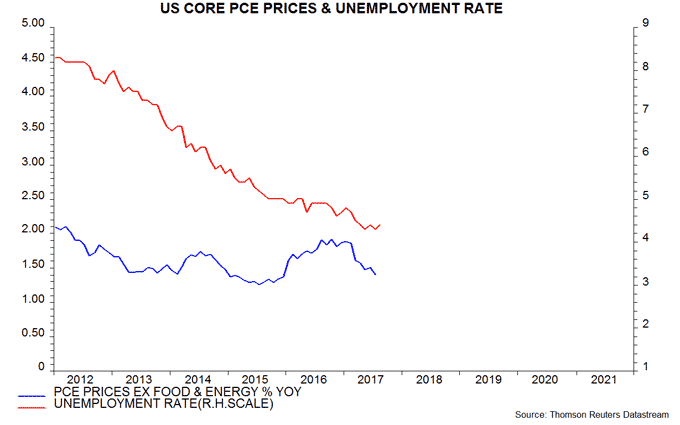
Standing back from recent volatility, however, core inflation has, as yet, shown no response to a large fall in the unemployment rate and wider measures of labour market slack in recent years. The Fed’s preferred core inflation measure, the annual change in the personal consumption expenditures (PCE) price index excluding food and energy, has remained below 2% despite the jobless rate falling from more than 8% to 4.4% since 2012 – second chart.

Recent experience does not, as is sometimes suggested, represent an anomaly by historical standards. Core inflation also remained below 2% over 1961-65 as the unemployment rate fell from over 7% to 4.5%. The core rate rose sharply, however, after the jobless rate moved below 4.5% in late 1965 and 4% in early 1966. Core inflation reached more than 3% by late 1966 and climbed further in 1968-69 as the labour market remained stretched – third chart.

As previously discussed, the forecast here, based on narrow money trends and the status of the Kitchin inventory cycle, is that the economy will grow robustly in late 2017 / early 2018, implying a further erosion of labour market slack. While the unemployment rate has stabilised at 4.3-4.4% since April, the jobs hard to find / jobs plentiful responses in the Conference Board consumer survey suggest that the trend remains down – fourth chart.

Fed officials are aware of the risk that the “Phillips curve” relationship between core inflation and labour market slack will steepen as the labour market continues to tighten. A 2016 Fed working paper found evidence, not confined to the 1960s, for such a non-linear effect, concluding that “it would be unwise to assume the Phillips curve remains so flat at all levels of the unemployment rate”.
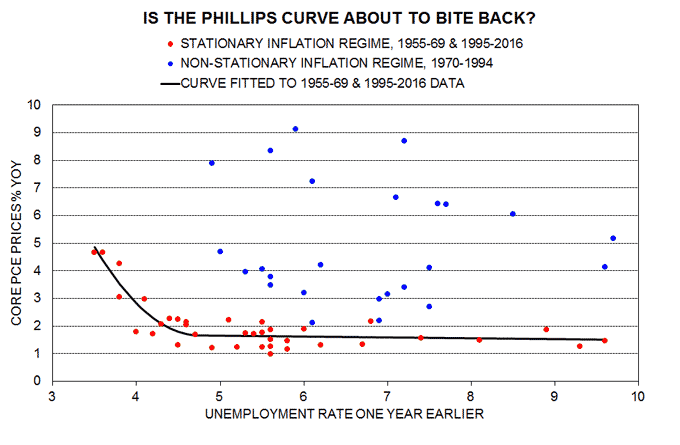
According to the paper, there have been two distinct inflation “regimes” since World War Two: a “stationary” regime, characterised by low, stable inflation expectations, covering the 1950s / 1960s and the period from the mid 1990s to the present; and a “non-stationary” regime in the 1970s, 1980s and early 1990s, when inflation expectations became “unanchored” because of shocks and policy mistakes. Separate Phillips curve relationships should be estimated for the two regimes.
Simplifying the analysis in the paper, the following chart shows a scatter plot of core inflation against the unemployment rate, lagged by one year, using annual data from 1955 to the present. There is no correlation across the data set as a whole (red and blue dots) but a Phillips curve can be fitted to the stationary regime data points alone (red dots). This curve is almost flat at unemployment rates above 4.5-5.0% but steepens progressively below this range.

Weak core inflation readings and a stabilisation of the unemployment rate since spring 2017 have caused some Fed officials to doubt the urgency of further policy tightening. With core price trends apparently normalising, a resumption of the fall in the jobless rate in late 2017 would be likely to shift the Fed’s focus back to inflationary risks from labour market overheating, strengthening the consensus in favour of proceeding with regular interest rate rises.

Reader Comments