
Will the global economy boom in 2017?
 Simon Ward
 Post a Comment
The forecasting approach employed here suggests a significant probability of a global economic boom in 2017. If activity, instead, remains weak, it will indicate that the monetary transmission mechanism has failed and monetary indicators have gone haywire – with extremely bearish implications for asset prices.
There are four key reasons for adopting a boom as a central investment scenario:
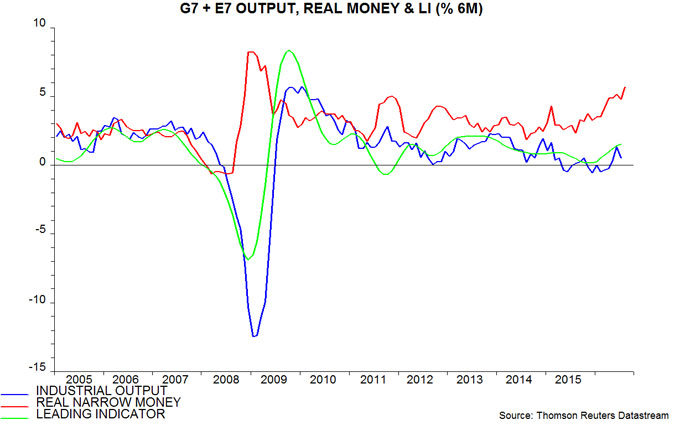
1) Global real narrow money is surging. Six-month growth of real narrow money in the G7 plus emerging E7 economies is estimated to have risen to about 5.5% (11.5% annualised) in August, the fastest since 2009, ahead of a sustained period of solid global expansion – see first chart. Monetary trends are strong across the major economies.
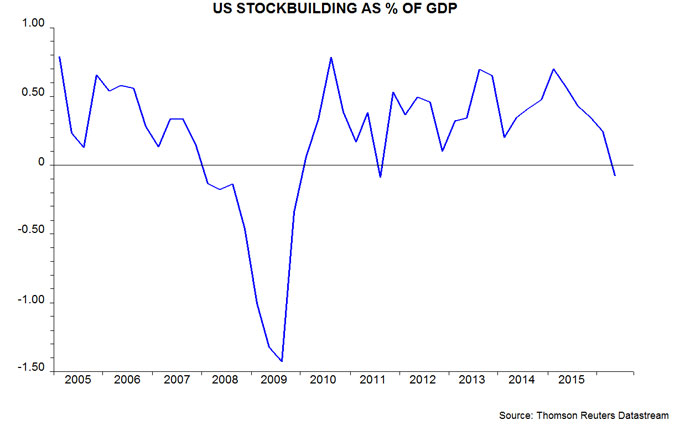
2) The US three- to five-year Kitchin stockbuilding cycle is probably at or near a low. Downswings in this cycle are associated with US / global economic slowdowns (e.g. 2011-12) or recessions if they coincide with weakness in the Juglar business investment and / or Kuznets housing cycles (e.g. 2008-09) – see previous post for more discussion. The change in inventories subtracted 0.8 percentage points from GDP growth in the year to the second quarter, turning negative in that quarter, suggesting that the current downswing is complete – second chart.
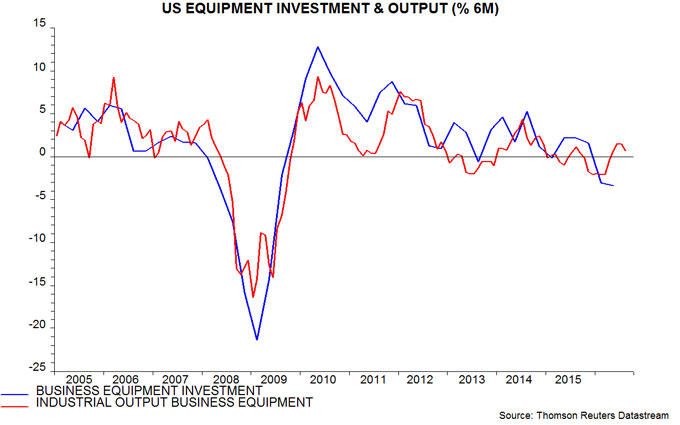
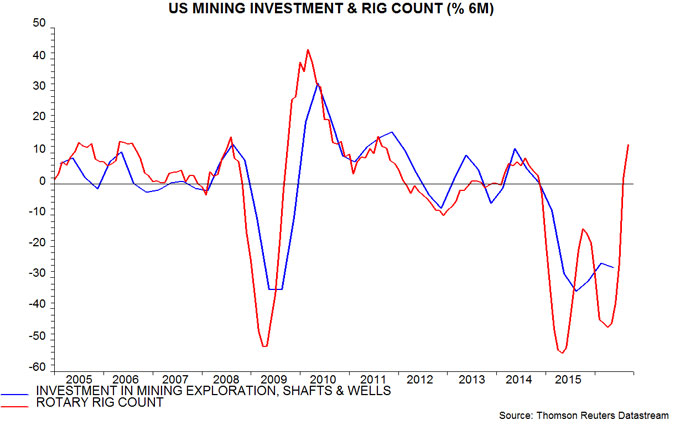
3) The US seven- to 11-year Juglar business investment cycle appears to be entering another expansion phase following a mid-upswing pause partly due to the oil bust. The cycle last bottomed in 2009 and is scheduled to reach another low between 2016 and 2020. A late date is now more likely, with recent data signalling a recovery in equipment and mining investment – third and fourth charts.
4) The OECD’s composite leading indicators are strengthening. Six-month growth in the G7 plus E7 trend-restored indicator calculated here from the OECD data is the strongest since 2014 – first chart.
Why could this forecast be wrong? The following objections to the above points have been raised in discussions:
1) Zero / negative rates have disrupted and may have destroyed the historical relationship between narrow money trends and future activity. Narrow money has been growing solidly for a while without this being reflected in stronger growth. Response: low rates have resulted in a faster fall in the velocity of circulation of narrow money but the directional relationship between changes in real money growth and output growth has remained intact. An adjusted real money growth measure incorporating a faster velocity decline and applying the historical average nine-month lead from money to activity has tracked output growth well and is signalling a strong upswing – fifth chart.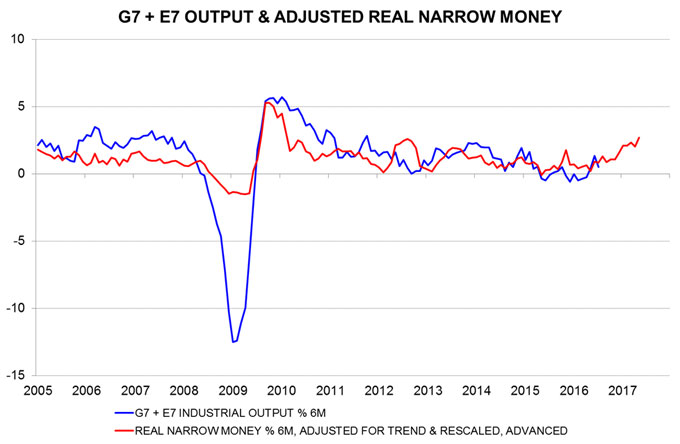
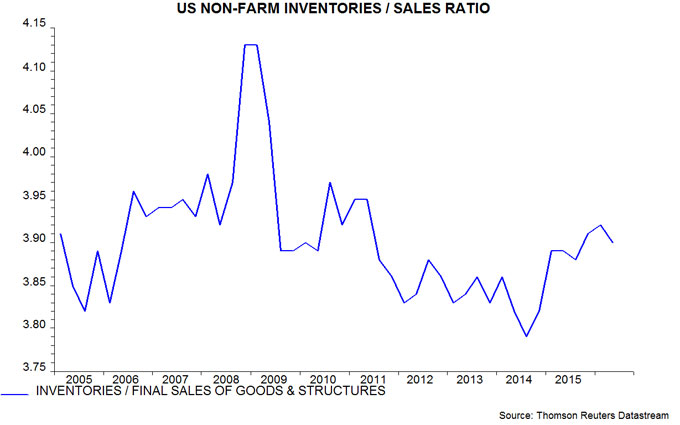
2) The US inventories to sales ratio remains elevated, suggesting that the Kitchin cycle downswing has further to run – sixth chart. Response: the cycle bottoms when the change in stocks has its maximum negative impact on GDP growth. This typically occurs soon after the inventories to sales ratio peaks but while it is still high – the current position. The ratio falls to normal or low levels only well into the upswing.
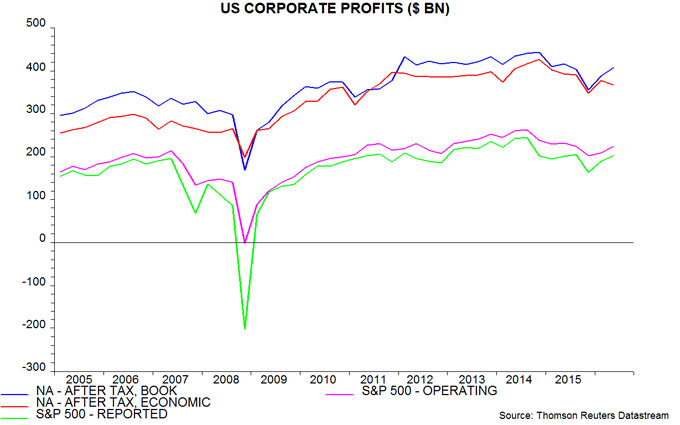
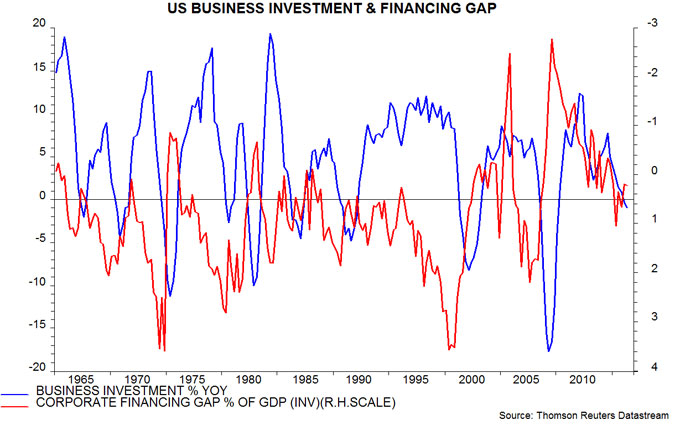
3) US profits remain weak, arguing against a pick-up in business investment. Response: profits fell between summer 2014 and late 2015, with energy extraction accounting for about half of the decline. There has, however, been a partial recovery so far in 2016, despite weak GDP growth – seventh chart. The corporate financing gap (i.e. the difference between capital spending and retained earnings), meanwhile, was a modest 0.2% of GDP in the second quarter, down from 1.0% in the second quarter of 2015; the gap is an inverse long leading indicator of investment – eighth chart. Low borrowing costs are an additional positive – the corporate BAA yield is currently 55 basis points below its five-year average.
4) The pick-up in the G7 plus E7 leading indicator has been driven by the E7 component, with the G7 component still weak – ninth chart. Response: the G7 leading indicator has started to turn up, while G7 real narrow money trends are strongly positive.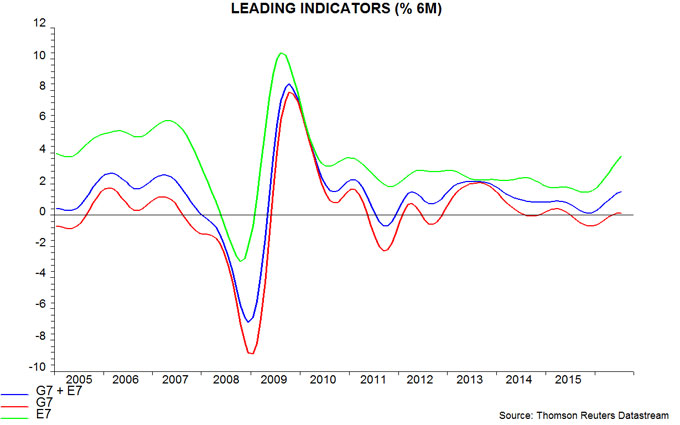
A forecast of economic strength will be maintained here but confidence in the scenario would be increased by a fall in the US inventories to sales ratio, a further recovery in US profits and confirmation of an upturn in the G7 leading indicator.
 View Printer Friendly Version
 Email Article to Friend
Reader Comments